Burger King 2012 Annual Report Download - page 9
Download and view the complete annual report
Please find page 9 of the 2012 Burger King annual report below. You can navigate through the pages in the report by either clicking on the pages listed below, or by using the keyword search tool below to find specific information within the annual report.-
 1
1 -
 2
2 -
 3
3 -
 4
4 -
 5
5 -
 6
6 -
 7
7 -
 8
8 -
 9
9 -
 10
10 -
 11
11 -
 12
12 -
 13
13 -
 14
14 -
 15
15 -
 16
16 -
 17
17 -
 18
18 -
 19
19 -
 20
20 -
21
-
22
-
23
-
24
-
25
-
26
-
27
-
28
-
29
-
30
-
31
-
32
-
33
-
34
-
35
-
36
-
37
-
38
-
39
-
40
-
41
-
42
-
43
-
44
-
45
-
46
-
47
-
48
-
49
-
50
-
51
-
52
-
53
-
54
-
55
-
56
-
57
-
58
-
59
-
60
-
61
-
62
-
63
-
64
-
65
-
66
-
67
-
68
-
69
-
70
-
71
-
72
-
73
-
74
-
75
-
76
-
77
-
78
-
79
-
80
-
81
-
82
-
83
-
84
-
85
-
86
-
87
-
88
-
89
-
90
-
91
-
92
-
93
-
94
-
95
-
96
-
97
-
98
-
99
-
100
-
101
-
102
-
103
-
104
-
105
-
106
-
107
-
108
-
109
-
110
-
111
-
112
-
113
-
114
-
115
-
116
-
117
-
118
-
119
-
120
-
121
-
122
-
123
-
124
-
125
-
126
-
127
-
128
-
129
-
130
-
131
-
132
-
133
-
134
-
135
-
136
-
137
-
138
-
139
-
140
-
141
-
142
-
143
-
144
-
145
-
146
-
147
-
148
-
149
-
150
-
151
-
152
-
153
-
154
-
155
-
156
-
157
-
158
-
159
-
160
-
161
-
162
-
163
-
164
-
165
-
166
-
167
-
168
-
169
-
170
-
171
-
172
-
173
-
174
-
175
-
176
-
177
-
178
-
179
-
180
-
181
-
182
-
183
-
184
-
185
-
186
-
187
-
188
-
189
-
190
-
191
-
192
-
193
-
194
-
195
-
196
-
197
-
198
-
199
-
200
-
201
-
202
-
203
-
204
-
205
-
206
-
207
-
208
-
209
 |
 |

Table of Contents
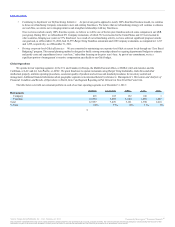
The table below sets forth our restaurant portfolio in our major markets in LAC and in all other markets as of December 31, 2012 and 2011:
Mexico 431 415
Brazil 224 140
Puerto Rico 183 180
Argentina 65 58
Venezuela 63 54
Colombia 28 18
Other 396 357
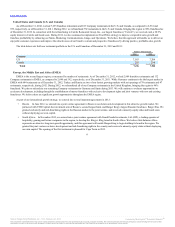
As of December 31, 2012, we had 1,007 franchise and 3 Company restaurants in APAC, as compared to 841 and 67, respectively, as of December 31,
2011. Australia is the largest market in APAC, with 357 restaurants as of December 31, 2012, all of which are franchised and operated under the name
, a brand that we own in Australia and New Zealand. Australia is the only market in which we operate under a brand other than
. We believe there are significant growth opportunities in APAC, and we will continue to pursue master franchise agreements and joint ventures throughout
the region.
As part of our international growth strategy, we entered into several important agreements in 2012:
• In June 2012, we entered into a joint venture agreement for China to accelerate unit development in this attractive growth market. We
partnered with Cartesian Capital Group, a global private equity firm, and members of the Kurdoglu family, who operate BKW’s largest
international franchisee, TAB Gida. We contributed our 44 Company restaurants in China to the joint venture in exchange for a significant
minority equity stake and board seats, and we granted exclusive development and sub-franchising rights for the Chinese market to the joint
venture.
• In September 2012, we sold 38 company-owned restaurants to Rancak Selera, the current franchisee in
Malaysia. As part of the transaction, BKW and Rancak Selera entered into master franchise and development agreements to further develop the
brand in both Malaysia and Singapore over the next 20 years.
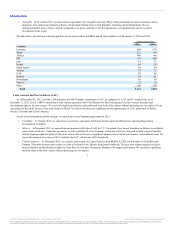
The table below sets forth our restaurant portfolio in our major markets in APAC and in all other markets as of December 31, 2012 and 2011:
Australia 357 347
South Korea 139 128
China 86 56
New Zealand 82 79
Japan 64 44
Malaysia 43 34
Singapore 41 45
Indonesia 40 30
Thailand 29 27
Other 129 118
8
®
Source: Burger King Worldwide, Inc., 10-K, February 22, 2013 Powered by Morningstar® Document Research℠
The information contained herein may not be copied, adapted or distributed and is not warranted to be accurate, complete or timely. The user assumes all risks for any damages or losses arising from any use of this
information, except to the extent such damages or losses cannot be limited or excluded by applicable law. Past financial performance is no guarantee of future results.