Burger King 2012 Annual Report Download - page 82
Download and view the complete annual report
Please find page 82 of the 2012 Burger King annual report below. You can navigate through the pages in the report by either clicking on the pages listed below, or by using the keyword search tool below to find specific information within the annual report.-
 1
1 -
2
-
3
-
4
-
5
-
6
-
7
-
8
-
9
-
10
-
11
-
12
-
13
-
14
-
15
-
16
-
17
-
18
-
19
-
20
-
21
-
22
-
23
-
24
-
25
-
26
-
27
-
28
-
29
-
30
-
31
-
32
-
33
-
34
-
35
-
36
-
37
-
38
-
39
-
40
-
41
-
42
-
43
-
44
-
45
-
46
-
47
-
48
-
49
-
50
-
51
-
52
-
53
-
54
-
55
-
56
-
57
-
58
-
59
-
60
-
61
-
62
-
63
-
64
-
65
-
66
-
67
-
68
-
69
-
70
-
71
-
 72
72 -
 73
73 -
 74
74 -
 75
75 -
 76
76 -
 77
77 -
 78
78 -
 79
79 -
 80
80 -
 81
81 -
 82
82 -
 83
83 -
 84
84 -
 85
85 -
 86
86 -
 87
87 -
 88
88 -
 89
89 -
 90
90 -
 91
91 -
 92
92 -
93
-
94
-
95
-
96
-
97
-
98
-
99
-
100
-
101
-
102
-
103
-
104
-
105
-
106
-
107
-
108
-
109
-
110
-
111
-
112
-
113
-
114
-
115
-
116
-
117
-
118
-
119
-
120
-
121
-
122
-
123
-
124
-
125
-
126
-
127
-
128
-
129
-
130
-
131
-
132
-
133
-
134
-
135
-
136
-
137
-
138
-
139
-
140
-
141
-
142
-
143
-
144
-
145
-
146
-
147
-
148
-
149
-
150
-
151
-
152
-
153
-
154
-
155
-
156
-
157
-
158
-
159
-
160
-
161
-
162
-
163
-
164
-
165
-
166
-
167
-
168
-
169
-
170
-
171
-
172
-
173
-
174
-
175
-
176
-
177
-
178
-
179
-
180
-
181
-
182
-
183
-
184
-
185
-
186
-
187
-
188
-
189
-
190
-
191
-
192
-
193
-
194
-
195
-
196
-
197
-
198
-
199
-
200
-
201
-
202
-
203
-
204
-
205
-
206
-
207
-
208
-
209
 |
 |

Table of Contents
Gains or losses resulting from changes in the fair value of derivatives are recognized in earnings or recorded in other comprehensive income (loss) and
recognized in the consolidated statements of operations when the hedged item affects earnings, depending on the purpose of the derivatives and whether they
qualify for, and we have applied, hedge accounting treatment.
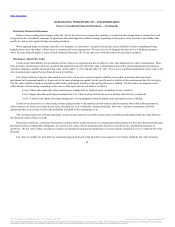
When applying hedge accounting, our policy is to designate, at a derivative’s inception, the specific assets, liabilities or future commitments being
hedged, and to assess the hedge’s effectiveness at inception and on an ongoing basis. We may elect not to designate the derivative as a hedging instrument
where the same financial impact is achieved in the financial statements. We do not enter into or hold derivatives for speculative purposes.
Certain assets and liabilities are not measured at fair value on an ongoing basis but are subject to fair value adjustment in certain circumstances. These
items primarily include long-lived assets, goodwill and intangible assets for which fair value is determined as part of the related impairment tests and asset
retirement obligations initially measured at fair value. At December 31, 2012 and December 31, 2011, there were no significant adjustments to fair value or fair
value measurements required for non-financial assets or liabilities.
Fair value is defined as the price that would be received to sell an asset or paid to transfer a liability in an orderly transaction between market
participants in the principal market, or if none exists, the most advantageous market, for the specific asset or liability at the measurement date (the exit price).
The fair value should be based on assumptions that market participants would use when pricing the asset or liability. The fair values are assigned a level
within the fair value hierarchy, depending on the source of the inputs into the calculation, as follows:
Observable inputs that reflect quoted prices (unadjusted) for identical assets or liabilities in active markets.
Inputs other than quoted prices included in Level 1 that are observable for the asset or liability either directly or indirectly.
Unobservable inputs reflecting management’s own assumptions about the inputs used in pricing the asset or liability.
Certain of our derivatives are valued using various pricing models or discounted cash flow analyses that incorporate observable market parameters,
such as interest rate yield curves and currency rates, classified as Level 2 within the valuation hierarchy. Derivative valuations incorporate credit risk
adjustments that are necessary to reflect the probability of default by the counterparty or us.
The carrying amounts for cash and equivalents, trade accounts and notes receivable and accounts and drafts payable approximate fair value based on
the short-term nature of these accounts.
Restricted investments, consisting of investment securities held in a rabbi trust to invest compensation deferred under our Executive Retirement Plan and
fund future deferred compensation obligations, are carried at fair value, with net unrealized gains and losses recorded in our consolidated statements of
operations. The fair value of these investment securities are determined using quoted market prices in active markets classified as Level 1 within the fair value
hierarchy.
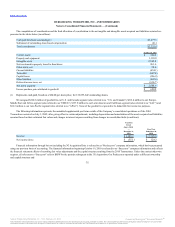
Fair value of variable rate term debt was estimated using inputs based on bid and offer prices and are Level 2 inputs within the fair value hierarchy.
81
Source: Burger King Worldwide, Inc., 10-K, February 22, 2013 Powered by Morningstar® Document Research℠
The information contained herein may not be copied, adapted or distributed and is not warranted to be accurate, complete or timely. The user assumes all risks for any damages or losses arising from any use of this
information, except to the extent such damages or losses cannot be limited or excluded by applicable law. Past financial performance is no guarantee of future results.