Burger King 2012 Annual Report Download - page 131
Download and view the complete annual report
Please find page 131 of the 2012 Burger King annual report below. You can navigate through the pages in the report by either clicking on the pages listed below, or by using the keyword search tool below to find specific information within the annual report.-
 1
1 -
2
-
3
-
4
-
5
-
6
-
7
-
8
-
9
-
10
-
11
-
12
-
13
-
14
-
15
-
16
-
17
-
18
-
19
-
20
-
21
-
22
-
23
-
24
-
25
-
26
-
27
-
28
-
29
-
30
-
31
-
32
-
33
-
34
-
35
-
36
-
37
-
38
-
39
-
40
-
41
-
42
-
43
-
44
-
45
-
46
-
47
-
48
-
49
-
50
-
51
-
52
-
53
-
54
-
55
-
56
-
57
-
58
-
59
-
60
-
61
-
62
-
63
-
64
-
65
-
66
-
67
-
68
-
69
-
70
-
71
-
72
-
73
-
74
-
75
-
76
-
77
-
78
-
79
-
80
-
81
-
82
-
83
-
84
-
85
-
86
-
87
-
88
-
89
-
90
-
91
-
92
-
93
-
94
-
95
-
96
-
97
-
98
-
99
-
100
-
101
-
102
-
103
-
104
-
105
-
106
-
107
-
108
-
109
-
110
-
111
-
112
-
113
-
114
-
115
-
116
-
117
-
118
-
119
-
120
-
 121
121 -
 122
122 -
 123
123 -
 124
124 -
 125
125 -
 126
126 -
 127
127 -
 128
128 -
 129
129 -
 130
130 -
 131
131 -
 132
132 -
 133
133 -
 134
134 -
 135
135 -
 136
136 -
 137
137 -
 138
138 -
 139
139 -
 140
140 -
 141
141 -
142
-
143
-
144
-
145
-
146
-
147
-
148
-
149
-
150
-
151
-
152
-
153
-
154
-
155
-
156
-
157
-
158
-
159
-
160
-
161
-
162
-
163
-
164
-
165
-
166
-
167
-
168
-
169
-
170
-
171
-
172
-
173
-
174
-
175
-
176
-
177
-
178
-
179
-
180
-
181
-
182
-
183
-
184
-
185
-
186
-
187
-
188
-
189
-
190
-
191
-
192
-
193
-
194
-
195
-
196
-
197
-
198
-
199
-
200
-
201
-
202
-
203
-
204
-
205
-
206
-
207
-
208
-
209
 |
 |

Table of Contents
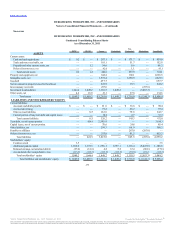
Current assets:
Cash and cash equivalents $0.2 $ — $ 287.1 $ — $ 171.7 $ — $ 459.0
Trade and notes receivable, net — — 101.1 — 51.7 — 152.8
Prepaids and other current assets, net — 1.2 54.6 — 13.4 — 69.2
Deferred income taxes, net — — 42.0 — 1.1 — 43.1
Total current assets 0.2 1.2 484.8 — 237.9 — 724.1
Property and equipment, net — — 846.4 — 180.1 — 1,026.5
Intangible assets, net — — 1,572.4 — 1,250.9 — 2,823.3
Goodwill — — 657.7 — — — 657.7
Net investment in property leased to franchisees — — 222.9 — 19.3 — 242.2
Intercompany receivable — — 287.0 — — (287.0) —
Investment in subsidiaries 1,044.4 1,449.2 1,110.5 1,449.2 — (5,053.3) —
Other assets, net 4.6 18.9 83.3 — 27.8 — 134.6
Total assets $ 1,049.2 $1,469.3 $5,265.0 $ 1,449.2 $1,716.0 $(5,340.3) $5,608.4
Current liabilities:
Accounts and drafts payable $ — $ — $61.6 $ — $ 36.8 $ — $ 98.4
Accrued advertising — — 71.2 — 26.2 — 97.4
Other accrued liabilities — 0.5 162.6 — 79.6 — 242.7
Current portion of long term debt and capital leases — — 30.8 — 2.7 — 33.5
Total current liabilities — 0.5 326.2 — 145.3 — 472.0
Term debt, net of current portion — 424.4 2,585.9 — — — 3,010.3
Capital leases, net of current portion — — 70.6 — 24.8 — 95.4
Other liabilities, net — — 299.3 — 66.9 — 366.2
Payables to affiliates — — — — 287.0 (287.0) —
Deferred income taxes, net — — 533.8 — 81.5 — 615.3
Total liabilities — 424.9 3,815.8 — 605.5 (287.0) 4,559.2
Stockholders’ equity:
Common stock 3.5 — — — — — 3.5
Additional paid-in capital 1,186.6 1,172.3 1,556.1 1,557.1 1,138.4 (5,423.9) 1,186.6
Retained earnings (accumulated deficit) (27.6) (14.6) 6.4 5.4 63.4 (60.6) (27.6)
Accumulated other comprehensive loss (113.3) (113.3) (113.3) (113.3) (91.3) 431.2 (113.3)
Total stockholders’ equity 1,049.2 1,044.4 1,449.2 1,449.2 1,110.5 (5,053.3) 1,049.2
Total liabilities and stockholders’ equity $ 1,049.2 $1,469.3 $5,265.0 $ 1,449.2 $1,716.0 $(5,340.3) $5,608.4
130
Source: Burger King Worldwide, Inc., 10-K, February 22, 2013 Powered by Morningstar® Document Research℠
The information contained herein may not be copied, adapted or distributed and is not warranted to be accurate, complete or timely. The user assumes all risks for any damages or losses arising from any use of this
information, except to the extent such damages or losses cannot be limited or excluded by applicable law. Past financial performance is no guarantee of future results.