Burger King 2012 Annual Report Download - page 6
Download and view the complete annual report
Please find page 6 of the 2012 Burger King annual report below. You can navigate through the pages in the report by either clicking on the pages listed below, or by using the keyword search tool below to find specific information within the annual report.-
 1
1 -
 2
2 -
 3
3 -
 4
4 -
 5
5 -
 6
6 -
 7
7 -
 8
8 -
 9
9 -
 10
10 -
 11
11 -
 12
12 -
 13
13 -
 14
14 -
 15
15 -
 16
16 -
 17
17 -
18
-
19
-
20
-
21
-
22
-
23
-
24
-
25
-
26
-
27
-
28
-
29
-
30
-
31
-
32
-
33
-
34
-
35
-
36
-
37
-
38
-
39
-
40
-
41
-
42
-
43
-
44
-
45
-
46
-
47
-
48
-
49
-
50
-
51
-
52
-
53
-
54
-
55
-
56
-
57
-
58
-
59
-
60
-
61
-
62
-
63
-
64
-
65
-
66
-
67
-
68
-
69
-
70
-
71
-
72
-
73
-
74
-
75
-
76
-
77
-
78
-
79
-
80
-
81
-
82
-
83
-
84
-
85
-
86
-
87
-
88
-
89
-
90
-
91
-
92
-
93
-
94
-
95
-
96
-
97
-
98
-
99
-
100
-
101
-
102
-
103
-
104
-
105
-
106
-
107
-
108
-
109
-
110
-
111
-
112
-
113
-
114
-
115
-
116
-
117
-
118
-
119
-
120
-
121
-
122
-
123
-
124
-
125
-
126
-
127
-
128
-
129
-
130
-
131
-
132
-
133
-
134
-
135
-
136
-
137
-
138
-
139
-
140
-
141
-
142
-
143
-
144
-
145
-
146
-
147
-
148
-
149
-
150
-
151
-
152
-
153
-
154
-
155
-
156
-
157
-
158
-
159
-
160
-
161
-
162
-
163
-
164
-
165
-
166
-
167
-
168
-
169
-
170
-
171
-
172
-
173
-
174
-
175
-
176
-
177
-
178
-
179
-
180
-
181
-
182
-
183
-
184
-
185
-
186
-
187
-
188
-
189
-
190
-
191
-
192
-
193
-
194
-
195
-
196
-
197
-
198
-
199
-
200
-
201
-
202
-
203
-
204
-
205
-
206
-
207
-
208
-
209
 |
 |

Table of Contents
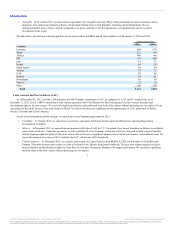
• As part of our goal to approach a nearly 100% franchised business model, we continue
to focus on refranchising Company restaurants to new and existing franchisees. We believe that our refranchising strategy will continue to enhance
our cash flow, accelerate our re-imaging initiative and strengthen relationships with key franchisees.
Once we have reached a nearly 100% franchise system, we believe we will be one of the few pure franchise and real estate companies in our QSR
peer group. During 2012, we refranchised 871 Company restaurants, of which 752 were located in the United States and 119 were located in
other countries, bringing our system to 97% franchised. As a result of our refranchising activity, we have achieved significant progress towards
our goal and, as of December 31, 2012, had 12,579 franchise restaurants and 418 Company restaurants, as compared to 11,217
and 1,295, respectively, as of December 31, 2011.
• We are committed to maintaining our corporate-level G&A at current levels through our “Zero Based
Budgeting” program. This annual planning method is designed to build a strong ownership culture by requiring departmental budgets to estimate
and justify costs and expenditures from a “zero base,” rather than focusing on the prior year’s base. As part of our commitment, we tie a
significant portion of management’s incentive compensation specifically to our G&A budget.
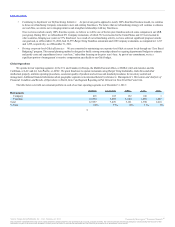
We operate in four reporting segments: (i) the U.S. and Canada; (ii) Europe, the Middle East and Africa, or EMEA; (iii) Latin America and the
Caribbean, or LAC and (iv) Asia Pacific, or APAC. We grant franchises to operate restaurants using trademarks, trade dress and other
intellectual property, uniform operating procedures, consistent quality of products and services and standard procedures for inventory control and
management. Additional financial information about geographic segments is incorporated herein by reference to
in Part II, Item 7 and Segment Reporting in Part II, Item 8 in Note 20 of this Form 10-K.
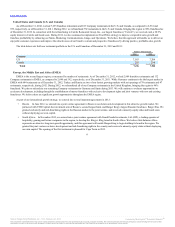
The table below sets forth our restaurant portfolio in each of our four operating segments as of December 31, 2012:
Company 418 183 132 100 3
Franchise 12,579 7,293 2,989 1,290 1,007
Total 12,997 7,476 3,121 1,390 1,010
% Total 100% 57% 24% 11% 8%
5
Source: Burger King Worldwide, Inc., 10-K, February 22, 2013 Powered by Morningstar® Document Research℠
The information contained herein may not be copied, adapted or distributed and is not warranted to be accurate, complete or timely. The user assumes all risks for any damages or losses arising from any use of this
information, except to the extent such damages or losses cannot be limited or excluded by applicable law. Past financial performance is no guarantee of future results.