Burger King 2012 Annual Report Download - page 39
Download and view the complete annual report
Please find page 39 of the 2012 Burger King annual report below. You can navigate through the pages in the report by either clicking on the pages listed below, or by using the keyword search tool below to find specific information within the annual report.-
 1
1 -
2
-
3
-
4
-
5
-
6
-
7
-
8
-
9
-
10
-
11
-
12
-
13
-
14
-
15
-
16
-
17
-
18
-
19
-
20
-
21
-
22
-
23
-
24
-
25
-
26
-
27
-
28
-
 29
29 -
 30
30 -
 31
31 -
 32
32 -
 33
33 -
 34
34 -
 35
35 -
 36
36 -
 37
37 -
 38
38 -
 39
39 -
 40
40 -
 41
41 -
 42
42 -
 43
43 -
 44
44 -
 45
45 -
 46
46 -
 47
47 -
 48
48 -
 49
49 -
50
-
51
-
52
-
53
-
54
-
55
-
56
-
57
-
58
-
59
-
60
-
61
-
62
-
63
-
64
-
65
-
66
-
67
-
68
-
69
-
70
-
71
-
72
-
73
-
74
-
75
-
76
-
77
-
78
-
79
-
80
-
81
-
82
-
83
-
84
-
85
-
86
-
87
-
88
-
89
-
90
-
91
-
92
-
93
-
94
-
95
-
96
-
97
-
98
-
99
-
100
-
101
-
102
-
103
-
104
-
105
-
106
-
107
-
108
-
109
-
110
-
111
-
112
-
113
-
114
-
115
-
116
-
117
-
118
-
119
-
120
-
121
-
122
-
123
-
124
-
125
-
126
-
127
-
128
-
129
-
130
-
131
-
132
-
133
-
134
-
135
-
136
-
137
-
138
-
139
-
140
-
141
-
142
-
143
-
144
-
145
-
146
-
147
-
148
-
149
-
150
-
151
-
152
-
153
-
154
-
155
-
156
-
157
-
158
-
159
-
160
-
161
-
162
-
163
-
164
-
165
-
166
-
167
-
168
-
169
-
170
-
171
-
172
-
173
-
174
-
175
-
176
-
177
-
178
-
179
-
180
-
181
-
182
-
183
-
184
-
185
-
186
-
187
-
188
-
189
-
190
-
191
-
192
-
193
-
194
-
195
-
196
-
197
-
198
-
199
-
200
-
201
-
202
-
203
-
204
-
205
-
206
-
207
-
208
-
209
 |
 |

Table of Contents
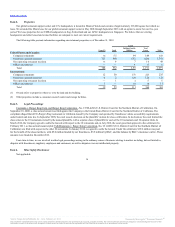
We continue to aggressively pursue refranchising and regional development opportunities as we implement our global portfolio realignment project. We
expect to continue to incur expenses which we believe will decline as we finalize the execution of our refranchising strategy. Further, we may record net losses
and impairment charges associated with future refranchising activity.
On April 3, 2012, Burger King Worldwide Holdings, Inc., a Delaware corporation and the indirect parent company of Holdings (“Worldwide”), entered
into a Business Combination Agreement and Plan of Merger, dated as of April 3, 2012, by and among Justice Holdings Limited, the Company, Justice Holdco
LLC and Worldwide (the “Business Combination Agreement”). This transaction closed on June 20, 2012, the Company changed its name to Burger King
Worldwide, Inc. and our stock began trading on the New York Stock Exchange under the ticker symbol “BKW.”
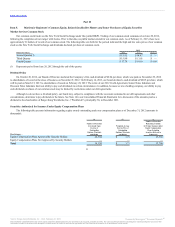
As a result of the increase in our equity value implied by the Business Combination Agreement, we recorded $5.9 million of one-time share-based
compensation expense related to share-based awards granted during 2012. We also incurred $21.1 million of professional fees and other transaction costs in
2012 associated with the Business Combination Agreement.
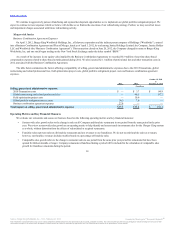
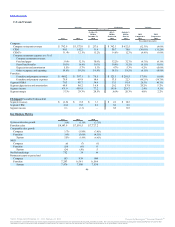
The table below summarizes the factors affecting comparability of selling, general and administrative expenses due to the 2010 Transactions, global
restructuring and related professional fees, field optimization project costs, global portfolio realignment project costs and business combination agreement
expenses.
2010 Transaction costs $ — $3.7 $94.9
Global restructuring and related professional fees — 46.5 67.2
Field optimization project costs — 10.6 —
Global portfolio realignment project costs 30.2 7.6 —
Business combination agreement expenses 27.0 — —
$57.2 $ 68.4 $162.1
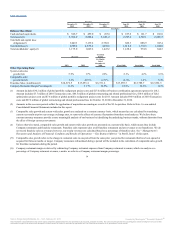
We evaluate our restaurants and assess our business based on the following operating metrics and key financial measures:
• System-wide sales growth refers to the change in sales at all Company and franchise restaurants in one period from the same period in the prior
year. We review system-wide sales growth as an operating metric to help identify and assess trends in restaurant sales for the system
as a whole, without distortion from the effects of refranchised or acquired restaurants.
• Franchise sales represent sales at all franchise restaurants and are revenues to our franchisees. We do not record franchise sales as revenues;
however, our franchise revenues include royalties based on a percentage of franchise sales.
• Comparable sales growth refers to the change in restaurant sales in one period from the same prior year period for restaurants that have been
opened for thirteen months or longer. Company restaurants refranchised during a period will be included in the calculation of comparable sales
growth for franchise restaurants during the period.
38
Source: Burger King Worldwide, Inc., 10-K, February 22, 2013 Powered by Morningstar® Document Research℠
The information contained herein may not be copied, adapted or distributed and is not warranted to be accurate, complete or timely. The user assumes all risks for any damages or losses arising from any use of this
information, except to the extent such damages or losses cannot be limited or excluded by applicable law. Past financial performance is no guarantee of future results.