Burger King 2012 Annual Report Download - page 76
Download and view the complete annual report
Please find page 76 of the 2012 Burger King annual report below. You can navigate through the pages in the report by either clicking on the pages listed below, or by using the keyword search tool below to find specific information within the annual report.-
 1
1 -
2
-
3
-
4
-
5
-
6
-
7
-
8
-
9
-
10
-
11
-
12
-
13
-
14
-
15
-
16
-
17
-
18
-
19
-
20
-
21
-
22
-
23
-
24
-
25
-
26
-
27
-
28
-
29
-
30
-
31
-
32
-
33
-
34
-
35
-
36
-
37
-
38
-
39
-
40
-
41
-
42
-
43
-
44
-
45
-
46
-
47
-
48
-
49
-
50
-
51
-
52
-
53
-
54
-
55
-
56
-
57
-
58
-
59
-
60
-
61
-
62
-
63
-
64
-
65
-
 66
66 -
 67
67 -
 68
68 -
 69
69 -
 70
70 -
 71
71 -
 72
72 -
 73
73 -
 74
74 -
 75
75 -
 76
76 -
 77
77 -
 78
78 -
 79
79 -
 80
80 -
 81
81 -
 82
82 -
 83
83 -
 84
84 -
 85
85 -
 86
86 -
87
-
88
-
89
-
90
-
91
-
92
-
93
-
94
-
95
-
96
-
97
-
98
-
99
-
100
-
101
-
102
-
103
-
104
-
105
-
106
-
107
-
108
-
109
-
110
-
111
-
112
-
113
-
114
-
115
-
116
-
117
-
118
-
119
-
120
-
121
-
122
-
123
-
124
-
125
-
126
-
127
-
128
-
129
-
130
-
131
-
132
-
133
-
134
-
135
-
136
-
137
-
138
-
139
-
140
-
141
-
142
-
143
-
144
-
145
-
146
-
147
-
148
-
149
-
150
-
151
-
152
-
153
-
154
-
155
-
156
-
157
-
158
-
159
-
160
-
161
-
162
-
163
-
164
-
165
-
166
-
167
-
168
-
169
-
170
-
171
-
172
-
173
-
174
-
175
-
176
-
177
-
178
-
179
-
180
-
181
-
182
-
183
-
184
-
185
-
186
-
187
-
188
-
189
-
190
-
191
-
192
-
193
-
194
-
195
-
196
-
197
-
198
-
199
-
200
-
201
-
202
-
203
-
204
-
205
-
206
-
207
-
208
-
209
 |
 |

Table of Contents
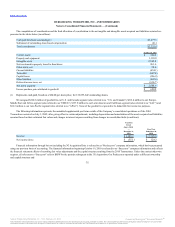
The computations of consideration and the final allocation of consideration to the net tangible and intangible assets acquired and liabilities assumed are
presented in the tables below (in millions):
Cash paid for shares outstanding(1) $3,277.3
Settlement of outstanding share-based compensation 48.1
Total consideration $3,325.4
Current assets $ 508.2
Property and equipment 1,118.0
Intangible assets 2,945.8
Net investment in property leased to franchisees 261.6
Other assets, net 58.6
Current liabilities (454.1)
Term debt (667.4)
Capital leases (106.8)
Other liabilities (402.6)
Deferred income taxes, net (616.7)
Net assets acquired $2,644.6
Excess purchase price attributed to goodwill $ 680.8
(1) Represents cash paid, based on a $24.00 per share price, for 136,555,642 outstanding shares.
We assigned $260.3 million of goodwill to our U.S. and Canada segment (also referred to as “U.S. and Canada”), $216.4 million to our Europe,
Middle East and Africa segment (also referred to as “EMEA”), $137.9 million to our Latin America and Caribbean segment (also referred to as “LAC”) and
$66.2 million to our Asia Pacific segment (also referred to as “APAC”). None of the goodwill is expected to be deductible for income tax purposes.
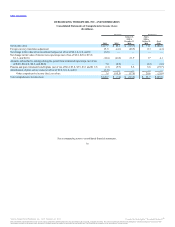
The following information represents the unaudited supplemental pro forma results of the Company’s consolidated operations as if the 2010
Transactions occurred on July 1, 2009, after giving effect to certain adjustments, including depreciation and amortization of the assets acquired and liabilities
assumed based on their estimated fair values and changes in interest expense resulting from changes in consolidated debt (in millions):
Revenue $1,185.2 $2,505.8
Net income (loss) $(55.1) $ 128.2
Financial information through but not including the 3G Acquisition Date is referred to as “Predecessor” company information, which has been prepared
using our previous basis of accounting. The financial information beginning October 19, 2010 is referred to as “Successor” company information and reflects
the financial statement effects of recording fair value adjustments and the capital structure resulting from the 2010 Transactions. Unless the context otherwise
requires, all references to “Successor” refer to BKW for the periods subsequent to the 3G Acquisition. Our Predecessor operated under a different ownership
and capital structure and
75
Source: Burger King Worldwide, Inc., 10-K, February 22, 2013 Powered by Morningstar® Document Research℠
The information contained herein may not be copied, adapted or distributed and is not warranted to be accurate, complete or timely. The user assumes all risks for any damages or losses arising from any use of this
information, except to the extent such damages or losses cannot be limited or excluded by applicable law. Past financial performance is no guarantee of future results.