Burger King 2012 Annual Report Download - page 101
Download and view the complete annual report
Please find page 101 of the 2012 Burger King annual report below. You can navigate through the pages in the report by either clicking on the pages listed below, or by using the keyword search tool below to find specific information within the annual report.-
 1
1 -
2
-
3
-
4
-
5
-
6
-
7
-
8
-
9
-
10
-
11
-
12
-
13
-
14
-
15
-
16
-
17
-
18
-
19
-
20
-
21
-
22
-
23
-
24
-
25
-
26
-
27
-
28
-
29
-
30
-
31
-
32
-
33
-
34
-
35
-
36
-
37
-
38
-
39
-
40
-
41
-
42
-
43
-
44
-
45
-
46
-
47
-
48
-
49
-
50
-
51
-
52
-
53
-
54
-
55
-
56
-
57
-
58
-
59
-
60
-
61
-
62
-
63
-
64
-
65
-
66
-
67
-
68
-
69
-
70
-
71
-
72
-
73
-
74
-
75
-
76
-
77
-
78
-
79
-
80
-
81
-
82
-
83
-
84
-
85
-
86
-
87
-
88
-
89
-
90
-
 91
91 -
 92
92 -
 93
93 -
 94
94 -
 95
95 -
 96
96 -
 97
97 -
 98
98 -
 99
99 -
 100
100 -
 101
101 -
 102
102 -
 103
103 -
 104
104 -
 105
105 -
 106
106 -
 107
107 -
 108
108 -
 109
109 -
 110
110 -
 111
111 -
112
-
113
-
114
-
115
-
116
-
117
-
118
-
119
-
120
-
121
-
122
-
123
-
124
-
125
-
126
-
127
-
128
-
129
-
130
-
131
-
132
-
133
-
134
-
135
-
136
-
137
-
138
-
139
-
140
-
141
-
142
-
143
-
144
-
145
-
146
-
147
-
148
-
149
-
150
-
151
-
152
-
153
-
154
-
155
-
156
-
157
-
158
-
159
-
160
-
161
-
162
-
163
-
164
-
165
-
166
-
167
-
168
-
169
-
170
-
171
-
172
-
173
-
174
-
175
-
176
-
177
-
178
-
179
-
180
-
181
-
182
-
183
-
184
-
185
-
186
-
187
-
188
-
189
-
190
-
191
-
192
-
193
-
194
-
195
-
196
-
197
-
198
-
199
-
200
-
201
-
202
-
203
-
204
-
205
-
206
-
207
-
208
-
209
 |
 |

Table of Contents
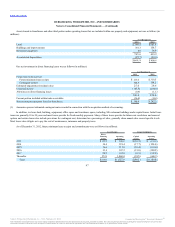
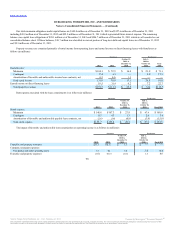
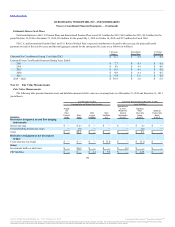
The U.S. Federal tax statutory rate reconciles to the effective tax rate as follows:
U.S. Federal income tax rate 35.0% 35.0% (35.0)% 35.0% 35.0%
State income taxes, net of federal income tax benefit 1.0 1.0 (2.9) 3.0 3.4
Costs/(Benefits) and taxes related to foreign operations 10.7 14.6 11.3 (2.5) 1.7
Foreign tax rate differential (25.0) (26.2) 0.1 (8.8) (5.6)
Foreign exchange differential on tax benefits — (0.1) 0.2 (0.6) 0.3
Change in valuation allowance (1.1) 3.8 3.2 (4.5) (0.6)
Change in accrual for tax uncertainties 1.6 1.8 0.2 (2.6) 0.2
Deductible FTC (3.2) (3.7) — — —
Non Deductible Transaction Costs 2.5 (1.2) 3.5 — —
Other 4.8 (1.8) (0.2) (0.8) (0.1)
Effective income tax rate 26.3% 23.2% (19.6)% 18.2% 34.3%
Our effective tax rate was 26.3% for 2012, primarily as a result of the current mix of income from multiple tax jurisdictions, the release of valuation
allowance and the impact of costs on refranchisings primarily in foreign jurisdictions. Our effective tax rate 23.2% for 2011, primarily as a result of the
exclusion of the tax benefit of foreign ordinary losses not expected to be realized, the current mix of income from multiple tax jurisdictions and the resolution of
state tax audits. Our effective tax rate was (19.6%) for the period from October 19, 2010 through December 31, 2010, primarily as a result of the current mix
of income from multiple tax jurisdictions and the 2010 Transactions. Our effective tax rate was 18.2% for the period from July 1, 2010 through October 18,
2010, primarily as a result of the mix of income from multiple tax jurisdictions and the sale of the Netherlands entity. Our effective tax rate was 34.3% for
Fiscal 2010, primarily as a result of the current mix of income from multiple tax jurisdictions and currency fluctuations.
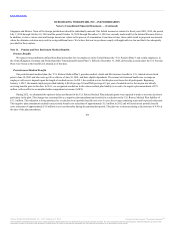
Income tax expense/(benefit) includes a decrease in valuation allowance primarily related to deferred tax assets in foreign countries of $(8.3) million for
2012, an increase in valuation allowance primarily related to deferred tax assets in foreign countries of $4.6 million for 2011, an increase in valuation
allowance related to foreign tax credit carryforwards and deferred tax assets in foreign countries of $3.3 million for the period from October 19, 2010 through
December 31, 2010, a decrease in valuation allowance related to deferred tax assets in foreign countries of $3.8 for the period from July 1, 2010 through
October 18, 2010, and a decrease of $1.7 million for Fiscal 2010.
100
Source: Burger King Worldwide, Inc., 10-K, February 22, 2013 Powered by Morningstar® Document Research℠
The information contained herein may not be copied, adapted or distributed and is not warranted to be accurate, complete or timely. The user assumes all risks for any damages or losses arising from any use of this
information, except to the extent such damages or losses cannot be limited or excluded by applicable law. Past financial performance is no guarantee of future results.