Burger King 2012 Annual Report Download - page 40
Download and view the complete annual report
Please find page 40 of the 2012 Burger King annual report below. You can navigate through the pages in the report by either clicking on the pages listed below, or by using the keyword search tool below to find specific information within the annual report.-
 1
1 -
2
-
3
-
4
-
5
-
6
-
7
-
8
-
9
-
10
-
11
-
12
-
13
-
14
-
15
-
16
-
17
-
18
-
19
-
20
-
21
-
22
-
23
-
24
-
25
-
26
-
27
-
28
-
29
-
 30
30 -
 31
31 -
 32
32 -
 33
33 -
 34
34 -
 35
35 -
 36
36 -
 37
37 -
 38
38 -
 39
39 -
 40
40 -
 41
41 -
 42
42 -
 43
43 -
 44
44 -
 45
45 -
 46
46 -
 47
47 -
 48
48 -
 49
49 -
 50
50 -
51
-
52
-
53
-
54
-
55
-
56
-
57
-
58
-
59
-
60
-
61
-
62
-
63
-
64
-
65
-
66
-
67
-
68
-
69
-
70
-
71
-
72
-
73
-
74
-
75
-
76
-
77
-
78
-
79
-
80
-
81
-
82
-
83
-
84
-
85
-
86
-
87
-
88
-
89
-
90
-
91
-
92
-
93
-
94
-
95
-
96
-
97
-
98
-
99
-
100
-
101
-
102
-
103
-
104
-
105
-
106
-
107
-
108
-
109
-
110
-
111
-
112
-
113
-
114
-
115
-
116
-
117
-
118
-
119
-
120
-
121
-
122
-
123
-
124
-
125
-
126
-
127
-
128
-
129
-
130
-
131
-
132
-
133
-
134
-
135
-
136
-
137
-
138
-
139
-
140
-
141
-
142
-
143
-
144
-
145
-
146
-
147
-
148
-
149
-
150
-
151
-
152
-
153
-
154
-
155
-
156
-
157
-
158
-
159
-
160
-
161
-
162
-
163
-
164
-
165
-
166
-
167
-
168
-
169
-
170
-
171
-
172
-
173
-
174
-
175
-
176
-
177
-
178
-
179
-
180
-
181
-
182
-
183
-
184
-
185
-
186
-
187
-
188
-
189
-
190
-
191
-
192
-
193
-
194
-
195
-
196
-
197
-
198
-
199
-
200
-
201
-
202
-
203
-
204
-
205
-
206
-
207
-
208
-
209
 |
 |

Table of Contents
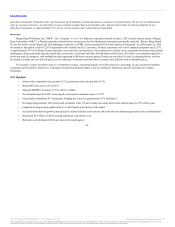
• Average restaurant sales refer to the total sales averaged over total store months for all Company and franchise restaurants open during that period.
• Net restaurant growth (“NRG”) represents the opening of new restaurants during a stated period, net of closures.
• Net refranchisings refer to sales of Company restaurants to franchisees, net of acquisitions of franchise restaurants by us.
Comparable sales growth and system-wide sales growth are measured on a constant currency basis, which means the results exclude the effect of foreign
currency translation and are calculated by translating current year results at prior year exchange rates. We analyze certain key financial measures on a constant
currency basis as this helps identify underlying business trends, without distortion from the effects of currency movements (“FX impact”).
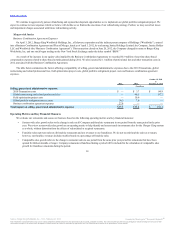
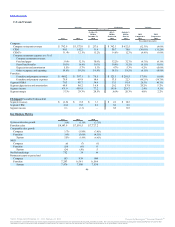
In addition, we evaluate our Company restaurants and assess our total business based on the following key financial measures:
• Company restaurant margin, or CRM, is derived by subtracting Company restaurant expenses from Company restaurant revenues for a stated
period, which we analyze as a percentage of Company restaurant revenues, a metric we refer to as Company restaurant margin %, or CRM %.
Company restaurant expenses are comprised of food, paper and product costs, payroll and employee benefits (“labor” costs) and occupancy and
other operating costs, which include rent and depreciation and amortization related to restaurant properties (“occupancy and other operating”
costs). Food, paper and product costs vary with sales volume, while labor and occupancy costs are primarily fixed costs with variable
components. We review the relationship between our Company restaurant expenses and Company restaurant revenues in the context of how those
relationships affect CRM and CRM %. As a result of our refranchising initiative, the impact of CRM and CRM% on our operating results has
diminished.
• Adjusted EBITDA represents earnings (net income or loss) before interest, taxes, depreciation and amortization adjusted to exclude specifically
identified items that management believes do not directly reflect our core operations. These items include share-based compensation and non-cash
compensation expense, other operating (income) expenses, net, and all other specifically identified costs associated with non-recurring projects;
2010 Transaction costs, global restructuring and related professional fees, field optimization project costs, global portfolio realignment project
costs and business combination agreement expenses. See .
39
Source: Burger King Worldwide, Inc., 10-K, February 22, 2013 Powered by Morningstar® Document Research℠
The information contained herein may not be copied, adapted or distributed and is not warranted to be accurate, complete or timely. The user assumes all risks for any damages or losses arising from any use of this
information, except to the extent such damages or losses cannot be limited or excluded by applicable law. Past financial performance is no guarantee of future results.