Burger King 2012 Annual Report Download - page 41
Download and view the complete annual report
Please find page 41 of the 2012 Burger King annual report below. You can navigate through the pages in the report by either clicking on the pages listed below, or by using the keyword search tool below to find specific information within the annual report.-
 1
1 -
2
-
3
-
4
-
5
-
6
-
7
-
8
-
9
-
10
-
11
-
12
-
13
-
14
-
15
-
16
-
17
-
18
-
19
-
20
-
21
-
22
-
23
-
24
-
25
-
26
-
27
-
28
-
29
-
30
-
 31
31 -
 32
32 -
 33
33 -
 34
34 -
 35
35 -
 36
36 -
 37
37 -
 38
38 -
 39
39 -
 40
40 -
 41
41 -
 42
42 -
 43
43 -
 44
44 -
 45
45 -
 46
46 -
 47
47 -
 48
48 -
 49
49 -
 50
50 -
 51
51 -
52
-
53
-
54
-
55
-
56
-
57
-
58
-
59
-
60
-
61
-
62
-
63
-
64
-
65
-
66
-
67
-
68
-
69
-
70
-
71
-
72
-
73
-
74
-
75
-
76
-
77
-
78
-
79
-
80
-
81
-
82
-
83
-
84
-
85
-
86
-
87
-
88
-
89
-
90
-
91
-
92
-
93
-
94
-
95
-
96
-
97
-
98
-
99
-
100
-
101
-
102
-
103
-
104
-
105
-
106
-
107
-
108
-
109
-
110
-
111
-
112
-
113
-
114
-
115
-
116
-
117
-
118
-
119
-
120
-
121
-
122
-
123
-
124
-
125
-
126
-
127
-
128
-
129
-
130
-
131
-
132
-
133
-
134
-
135
-
136
-
137
-
138
-
139
-
140
-
141
-
142
-
143
-
144
-
145
-
146
-
147
-
148
-
149
-
150
-
151
-
152
-
153
-
154
-
155
-
156
-
157
-
158
-
159
-
160
-
161
-
162
-
163
-
164
-
165
-
166
-
167
-
168
-
169
-
170
-
171
-
172
-
173
-
174
-
175
-
176
-
177
-
178
-
179
-
180
-
181
-
182
-
183
-
184
-
185
-
186
-
187
-
188
-
189
-
190
-
191
-
192
-
193
-
194
-
195
-
196
-
197
-
198
-
199
-
200
-
201
-
202
-
203
-
204
-
205
-
206
-
207
-
208
-
209
 |
 |

Table of Contents
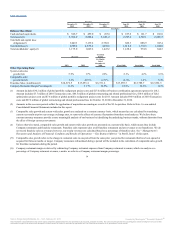
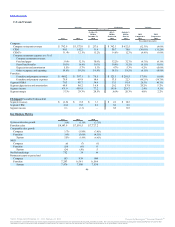
Tabular amounts in millions of dollars unless noted otherwise.
Revenues:
Company restaurant revenues $1,169.0 $1,638.7 $331.7 $514.5 $893.3 (28.7)% (5.8)%
Franchise and property revenues 797.3 697.0 135.1 203.2 326.6 14.4% 4.8%
Total revenues 1,966.3 2,335.7 466.8 717.7 1,219.9 (15.8)% (2.9)%
Company restaurant expenses:
Food, paper and product costs 382.2 524.7 102.8 162.6 285.2 27.2% 4.7%
Payroll and employee benefits 345.1 481.2 98.3 154.2 277.5 28.3% 9.2%
Occupancy and other operating costs 309.9 441.5 91.7 127.7 232.5 29.8% 2.3%
Total Company restaurant expenses 1,037.2 1,447.4 292.8 444.5 795.2 28.3% 5.6%
Franchise and property expenses 112.1 97.1 21.3 22.2 33.0 (15.4)% (26.9)%
Selling, general and administrative expenses 346.0 417.4 247.2 153.1 235.8 17.1% 34.4%
Other operating (income) expenses, net 53.3 11.3 (8.7) (3.6) (5.8) (371.7)% 162.4%
Total operating costs and expenses 1,548.6 1,973.2 552.6 616.2 1,058.2 21.5% 11.4%
Income (loss) from operations 417.7 362.5 (85.8) 101.5 161.7 15.2% 104.3%
Interest expense, net 223.8 226.7 58.1 14.6 23.9 1.3% (134.7)%
Loss on early extinguishment of debt 34.2 21.1 — — — (62.1)% NM
Income (loss) before income taxes 159.7 114.7 (143.9) 86.9 137.8 39.2% 42.0%
Income tax expense (benefit) 42.0 26.6 (28.2) 15.8 47.8 (57.9)% 24.9%
Net income (loss) $117.7 $88.1 $(115.7) $71.1 $90.0 33.6% 94.1%
Favorable/(Unfavorable)
Consolidated revenues $(41.3) $35.6 $(5.8) $(11.5) $13.4
Consolidated CRM (3.1) 2.6 (0.3) (1.0) 1.1
Consolidated SG&A 6.5 (8.2) 3.6 3.1 (1.3)
Consolidated income (loss) from operations (10.9) 5.3 1.0 (2.9) (2.0)
Consolidated net income (loss) (10.6) 5.7 — (3.0) (3.0)
Consolidated Adjusted EBITDA (12.8) 4.5 0.2 (2.7) 0.2
System sales growth 5.9% 1.7% 1.5%
Franchise sales $14,672.5 $13,653.4 $13,086.8
Comparable sales growth
Company 3.6% 0.1% (3.3)%
Franchise 3.2% (0.6)% (2.3)%
System 3.2% (0.5)% (2.4)%
Average restaurant sales (in thousands) $1,267.9 $1,248.0 $1,225.1
Net Restaurant Growth (NRG)
Company (6) (4) 4
Franchise 491 265 169
System 485 261 173
Net Refranchisings 871 45 82
Restaurant counts at period end
Company 418 1,295 1,344
Franchise 12,579 11,217 10,907
System 12,997 12,512 12,251
NM — Not Meaningful
40
Source: Burger King Worldwide, Inc., 10-K, February 22, 2013 Powered by Morningstar® Document Research℠
The information contained herein may not be copied, adapted or distributed and is not warranted to be accurate, complete or timely. The user assumes all risks for any damages or losses arising from any use of this
information, except to the extent such damages or losses cannot be limited or excluded by applicable law. Past financial performance is no guarantee of future results.