Burger King 2012 Annual Report Download - page 48
Download and view the complete annual report
Please find page 48 of the 2012 Burger King annual report below. You can navigate through the pages in the report by either clicking on the pages listed below, or by using the keyword search tool below to find specific information within the annual report.-
 1
1 -
2
-
3
-
4
-
5
-
6
-
7
-
8
-
9
-
10
-
11
-
12
-
13
-
14
-
15
-
16
-
17
-
18
-
19
-
20
-
21
-
22
-
23
-
24
-
25
-
26
-
27
-
28
-
29
-
30
-
31
-
32
-
33
-
34
-
35
-
36
-
37
-
 38
38 -
 39
39 -
 40
40 -
 41
41 -
 42
42 -
 43
43 -
 44
44 -
 45
45 -
 46
46 -
 47
47 -
 48
48 -
 49
49 -
 50
50 -
 51
51 -
 52
52 -
 53
53 -
 54
54 -
 55
55 -
 56
56 -
 57
57 -
 58
58 -
59
-
60
-
61
-
62
-
63
-
64
-
65
-
66
-
67
-
68
-
69
-
70
-
71
-
72
-
73
-
74
-
75
-
76
-
77
-
78
-
79
-
80
-
81
-
82
-
83
-
84
-
85
-
86
-
87
-
88
-
89
-
90
-
91
-
92
-
93
-
94
-
95
-
96
-
97
-
98
-
99
-
100
-
101
-
102
-
103
-
104
-
105
-
106
-
107
-
108
-
109
-
110
-
111
-
112
-
113
-
114
-
115
-
116
-
117
-
118
-
119
-
120
-
121
-
122
-
123
-
124
-
125
-
126
-
127
-
128
-
129
-
130
-
131
-
132
-
133
-
134
-
135
-
136
-
137
-
138
-
139
-
140
-
141
-
142
-
143
-
144
-
145
-
146
-
147
-
148
-
149
-
150
-
151
-
152
-
153
-
154
-
155
-
156
-
157
-
158
-
159
-
160
-
161
-
162
-
163
-
164
-
165
-
166
-
167
-
168
-
169
-
170
-
171
-
172
-
173
-
174
-
175
-
176
-
177
-
178
-
179
-
180
-
181
-
182
-
183
-
184
-
185
-
186
-
187
-
188
-
189
-
190
-
191
-
192
-
193
-
194
-
195
-
196
-
197
-
198
-
199
-
200
-
201
-
202
-
203
-
204
-
205
-
206
-
207
-
208
-
209
 |
 |

Table of Contents
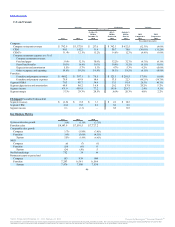
During 2012, system comparable sales growth of 3.5% in the U.S. and Canada was driven primarily by the implementation of our Four Pillars strategy.
During 2012, we enhanced our menu by launching four new menu platforms (salads, wraps, smoothies and desserts), expanded our chicken, coffee and
ancillary platforms and made compelling limited time offer promotions. We also implemented a marketing strategy that targets a broader consumer base with
more inclusive messaging and food centric advertising designed to balance value promotions and premium limited-time offerings.
During 2011, negative system comparable sales growth of 3.4% in the U.S. and Canada was primarily attributed to value promotions in 2010 compared
to 2011.
During 2012, Company restaurant revenues decreased primarily due to the net refranchising of 752 Company restaurants, partially offset by Company
comparable sales growth. FX impact was not significant.
During 2011, Company restaurant revenues decreased primarily due to the net refranchising of 38 Company restaurants and the effects of negative
Company comparable sales growth. These factors were partially offset by favorable FX impact in Canada.
During 2012, the decrease in CRM% reflects an increase in promotional activity to drive traffic and trial of limited time offer menu items, increases in
food, paper and product costs and an increase in repair and maintenance expenses associated with restaurants prepared for refranchisings, partially offset by
favorable adjustments to our self insurance reserve.
During 2011, CRM% decreased primarily due to the impact of sales deleverage on our fixed occupancy and other operating costs, the impact of
acquisition accounting, other operating costs to implement new initiatives at our Company restaurants and lower food margins driven by higher commodity
prices in the U.S. In addition, CRM% decreased due to a non-recurring $4.7 million favorable adjustment to the self insurance reserve in the U.S. and Canada
in 2010. These factors were partially offset by changes in restaurant compensation plans to more closely align incentive compensation with restaurant
performance, benefits realized from improvements in variable labor controls and scheduling in our restaurants and benefits derived from strategic pricing
initiatives.
During 2012, franchise and property revenues increased primarily due to the net refranchising of 752 Company restaurants and franchise comparable
sales growth, which resulted in increased royalties and rents. Additionally, renewal franchise fees increased due to the timing of renewals as a result of
incentives provided to franchisees to accelerate restaurant remodels. FX impact was not significant.
During 2011, franchise and property revenues decreased due to the impact of negative franchise comparable sales growth on royalties and contingent
rents and a decrease in renewal franchise fees due to the timing of renewals as a result of incentives provided to franchisees to accelerate restaurant remodels.
These factors were partially offset by favorable FX impact in Canada and the impact of acquisition accounting.
During 2012, franchise and property expenses increased primarily due to additional restaurants leased or subleased to franchisees as a result of
refranchisings, partially offset by a decrease in bad debt expense. FX impact was not significant.
During 2011, franchise and property expenses increased primarily due to additional restaurants leased or subleased to franchisees as a result of the net
refranchising of Company restaurants, the impact of acquisition accounting, including a $5.2 million increase in franchise agreement amortization and an
increase in bad debt expense.
47
Source: Burger King Worldwide, Inc., 10-K, February 22, 2013 Powered by Morningstar® Document Research℠
The information contained herein may not be copied, adapted or distributed and is not warranted to be accurate, complete or timely. The user assumes all risks for any damages or losses arising from any use of this
information, except to the extent such damages or losses cannot be limited or excluded by applicable law. Past financial performance is no guarantee of future results.