Burger King 2012 Annual Report Download - page 54
Download and view the complete annual report
Please find page 54 of the 2012 Burger King annual report below. You can navigate through the pages in the report by either clicking on the pages listed below, or by using the keyword search tool below to find specific information within the annual report.-
 1
1 -
2
-
3
-
4
-
5
-
6
-
7
-
8
-
9
-
10
-
11
-
12
-
13
-
14
-
15
-
16
-
17
-
18
-
19
-
20
-
21
-
22
-
23
-
24
-
25
-
26
-
27
-
28
-
29
-
30
-
31
-
32
-
33
-
34
-
35
-
36
-
37
-
38
-
39
-
40
-
41
-
42
-
43
-
 44
44 -
 45
45 -
 46
46 -
 47
47 -
 48
48 -
 49
49 -
 50
50 -
 51
51 -
 52
52 -
 53
53 -
 54
54 -
 55
55 -
 56
56 -
 57
57 -
 58
58 -
 59
59 -
 60
60 -
 61
61 -
 62
62 -
 63
63 -
 64
64 -
65
-
66
-
67
-
68
-
69
-
70
-
71
-
72
-
73
-
74
-
75
-
76
-
77
-
78
-
79
-
80
-
81
-
82
-
83
-
84
-
85
-
86
-
87
-
88
-
89
-
90
-
91
-
92
-
93
-
94
-
95
-
96
-
97
-
98
-
99
-
100
-
101
-
102
-
103
-
104
-
105
-
106
-
107
-
108
-
109
-
110
-
111
-
112
-
113
-
114
-
115
-
116
-
117
-
118
-
119
-
120
-
121
-
122
-
123
-
124
-
125
-
126
-
127
-
128
-
129
-
130
-
131
-
132
-
133
-
134
-
135
-
136
-
137
-
138
-
139
-
140
-
141
-
142
-
143
-
144
-
145
-
146
-
147
-
148
-
149
-
150
-
151
-
152
-
153
-
154
-
155
-
156
-
157
-
158
-
159
-
160
-
161
-
162
-
163
-
164
-
165
-
166
-
167
-
168
-
169
-
170
-
171
-
172
-
173
-
174
-
175
-
176
-
177
-
178
-
179
-
180
-
181
-
182
-
183
-
184
-
185
-
186
-
187
-
188
-
189
-
190
-
191
-
192
-
193
-
194
-
195
-
196
-
197
-
198
-
199
-
200
-
201
-
202
-
203
-
204
-
205
-
206
-
207
-
208
-
209
 |
 |

Table of Contents
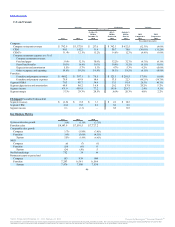
During 2012, negative system comparable sales growth of 0.5% in APAC was driven by negative comparable sales growth in Korea, Japan, New
Zealand and China, partially offset by positive comparable sales growth in Australia.
During 2011, negative system comparable sales growth of 0.4% in APAC was driven by negative comparable sales growth in Australia, partially offset
by positive comparable sales growth in Korea and China.
During 2012, Company restaurant revenues decreased due to the net refranchising of 60 Company restaurants during 2012 and unfavorable FX
impact, partially offset by positive Company comparable sales growth.
During 2011, Company restaurant revenues increased due to the acquisition of 35 restaurants in Singapore during Fiscal 2010, Company NRG, the
effects of Company comparable sales growth and favorable FX impact.
During 2012, CRM % increased primarily as a result of the leveraging effect of Company comparable sales growth on our fixed occupancy and other
operating costs and lower food, paper and product costs, partially offset by higher labor costs in Singapore.
During 2011, CRM % increased primarily as a result of the leveraging effect of comparable sales growth on our fixed occupancy and other operating
costs and improved food margins resulting from the acquisition of 35 restaurants in Singapore during Fiscal 2010, where food costs are lower than those in
other Company restaurant markets in the segment. These factors were partially offset by wage rate increases in Singapore.
During 2012, franchise and property revenues increased due to franchise NRG of 106 restaurants and the net refranchising of 60 Company restaurants
during 2012 which resulted in increased royalties. Additionally, initial franchise fees increased as a result of the increase in franchise NRG during 2012.
These factors were partially offset by negative franchise comparable sales growth. FX impact was not significant.
During 2011, franchise and property revenues increased due to royalties derived from franchise NRG, partially offset by negative franchise comparable
sales growth and unfavorable FX impact. Franchise and property expenses increased due to a $2.3 million increase in franchise agreement amortization.
During 2012 and 2011, segment income increased due to a decrease in segment SG&A and an increase in net franchise and property income as well as
an increase in CRM during 2011. The increase in segment income during 2012 was partially offset by a decrease in CRM.
During 2012 and 2011, segment margin increased primarily as a result of the higher contribution of franchise and property revenues in the segment,
which yield higher margins than Company restaurant revenues, and an increase in CRM%.
Our primary sources of liquidity are cash on hand, cash generated by operations and borrowings available under our 2012 Revolving Credit Facility (as
defined below). We have used, and may in the future use, our liquidity to make required interest and principal payments, to voluntarily repay and/or
repurchase our or one of
53
Source: Burger King Worldwide, Inc., 10-K, February 22, 2013 Powered by Morningstar® Document Research℠
The information contained herein may not be copied, adapted or distributed and is not warranted to be accurate, complete or timely. The user assumes all risks for any damages or losses arising from any use of this
information, except to the extent such damages or losses cannot be limited or excluded by applicable law. Past financial performance is no guarantee of future results.