Burger King 2012 Annual Report Download - page 44
Download and view the complete annual report
Please find page 44 of the 2012 Burger King annual report below. You can navigate through the pages in the report by either clicking on the pages listed below, or by using the keyword search tool below to find specific information within the annual report.-
 1
1 -
2
-
3
-
4
-
5
-
6
-
7
-
8
-
9
-
10
-
11
-
12
-
13
-
14
-
15
-
16
-
17
-
18
-
19
-
20
-
21
-
22
-
23
-
24
-
25
-
26
-
27
-
28
-
29
-
30
-
31
-
32
-
33
-
 34
34 -
 35
35 -
 36
36 -
 37
37 -
 38
38 -
 39
39 -
 40
40 -
 41
41 -
 42
42 -
 43
43 -
 44
44 -
 45
45 -
 46
46 -
 47
47 -
 48
48 -
 49
49 -
 50
50 -
 51
51 -
 52
52 -
 53
53 -
 54
54 -
55
-
56
-
57
-
58
-
59
-
60
-
61
-
62
-
63
-
64
-
65
-
66
-
67
-
68
-
69
-
70
-
71
-
72
-
73
-
74
-
75
-
76
-
77
-
78
-
79
-
80
-
81
-
82
-
83
-
84
-
85
-
86
-
87
-
88
-
89
-
90
-
91
-
92
-
93
-
94
-
95
-
96
-
97
-
98
-
99
-
100
-
101
-
102
-
103
-
104
-
105
-
106
-
107
-
108
-
109
-
110
-
111
-
112
-
113
-
114
-
115
-
116
-
117
-
118
-
119
-
120
-
121
-
122
-
123
-
124
-
125
-
126
-
127
-
128
-
129
-
130
-
131
-
132
-
133
-
134
-
135
-
136
-
137
-
138
-
139
-
140
-
141
-
142
-
143
-
144
-
145
-
146
-
147
-
148
-
149
-
150
-
151
-
152
-
153
-
154
-
155
-
156
-
157
-
158
-
159
-
160
-
161
-
162
-
163
-
164
-
165
-
166
-
167
-
168
-
169
-
170
-
171
-
172
-
173
-
174
-
175
-
176
-
177
-
178
-
179
-
180
-
181
-
182
-
183
-
184
-
185
-
186
-
187
-
188
-
189
-
190
-
191
-
192
-
193
-
194
-
195
-
196
-
197
-
198
-
199
-
200
-
201
-
202
-
203
-
204
-
205
-
206
-
207
-
208
-
209
 |
 |
Table of Contents
and fringe benefits, professional services and favorable FX impact. The decrease in Management G&A in 2011 was driven by a decrease in salary and fringe
benefits and a decrease in professional fees, which are directly attributable to the benefits derived from our global restructuring and implementation of a Zero
Based Budgeting (“ZBB”) program.
The decrease in our total general and administrative expenses in 2012 was driven primarily by a decrease in Management G&A and the completion of
our global restructuring and field optimization projects in 2011 partially offset by business combination agreement expenses and increases in global portfolio
realignment project costs and share-based compensation and non-cash incentive compensation expense.
The decrease in our total general and administrative expenses in 2011 was driven primarily by the decreases in Management G&A, 2010 Transaction
costs, global restructuring and related professional fees and share-based compensation, as well as a decrease in depreciation and amortization resulting from
acquisition accounting. These factors were partially offset by costs incurred in connection with our global portfolio realignment project and field optimization
project.
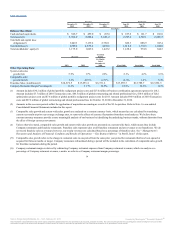
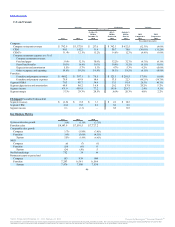
Net (gains) losses on disposal of assets, restaurant closures and refranchisings $30.8 $6.2 $5.8 $(3.2) $(3.4)
Litigation settlements and reserves, net 1.7 1.3 3.5 1.5 (0.9)
Foreign exchange net gains (4.2) (4.6) (21.4) (1.4) (4.4)
Loss on termination of interest rate cap 8.7 — — — —
Equity in net loss from unconsolidated affiliates 4.1 1.2 0.3 0.5 0.1
Other, net 12.2 7.2 3.1 (1.0) 2.8
Other operating (income) expense, net $53.3 $11.3 $(8.7) $(3.6) $ (5.8)
During 2012, interest expense, net decreased compared to 2011 primarily due to reduced borrowings as a result of principal payments and prepayments
of our Term Loan and repurchases of our Senior Notes and Discount Notes, partially offset by incremental interest expense on our Discount Notes due to the
timing of their issuance in the prior year and compounded interest.
During 2011, interest expense, net increased compared to 2010, reflecting an increase in borrowings and higher interest rates due to the 2010
Transactions, and interest expense on our Discount Notes.
The weighted average interest rate on our long-term debt was 7.29% for 2012, 7.50% for 2011 and 6.01% for 2010.
We recorded a $34.2 million loss on early extinguishment of debt in 2012 related to our 2012 debt refinancing as well as prepayments of our Term Loan
and repurchases of our Discount Notes and Senior Notes. We recorded a $21.1 million loss on early extinguishment of debt in 2011 related to our 2011 debt
refinancing as well as prepayments of our Term Loan and repurchases of our Senior Notes and Discount Notes.
43
Source: Burger King Worldwide, Inc., 10-K, February 22, 2013 Powered by Morningstar® Document Research℠
The information contained herein may not be copied, adapted or distributed and is not warranted to be accurate, complete or timely. The user assumes all risks for any damages or losses arising from any use of this
information, except to the extent such damages or losses cannot be limited or excluded by applicable law. Past financial performance is no guarantee of future results.