Burger King 2012 Annual Report Download - page 117
Download and view the complete annual report
Please find page 117 of the 2012 Burger King annual report below. You can navigate through the pages in the report by either clicking on the pages listed below, or by using the keyword search tool below to find specific information within the annual report.-
 1
1 -
2
-
3
-
4
-
5
-
6
-
7
-
8
-
9
-
10
-
11
-
12
-
13
-
14
-
15
-
16
-
17
-
18
-
19
-
20
-
21
-
22
-
23
-
24
-
25
-
26
-
27
-
28
-
29
-
30
-
31
-
32
-
33
-
34
-
35
-
36
-
37
-
38
-
39
-
40
-
41
-
42
-
43
-
44
-
45
-
46
-
47
-
48
-
49
-
50
-
51
-
52
-
53
-
54
-
55
-
56
-
57
-
58
-
59
-
60
-
61
-
62
-
63
-
64
-
65
-
66
-
67
-
68
-
69
-
70
-
71
-
72
-
73
-
74
-
75
-
76
-
77
-
78
-
79
-
80
-
81
-
82
-
83
-
84
-
85
-
86
-
87
-
88
-
89
-
90
-
91
-
92
-
93
-
94
-
95
-
96
-
97
-
98
-
99
-
100
-
101
-
102
-
103
-
104
-
105
-
106
-
 107
107 -
 108
108 -
 109
109 -
 110
110 -
 111
111 -
 112
112 -
 113
113 -
 114
114 -
 115
115 -
 116
116 -
 117
117 -
 118
118 -
 119
119 -
 120
120 -
 121
121 -
 122
122 -
 123
123 -
 124
124 -
 125
125 -
 126
126 -
 127
127 -
128
-
129
-
130
-
131
-
132
-
133
-
134
-
135
-
136
-
137
-
138
-
139
-
140
-
141
-
142
-
143
-
144
-
145
-
146
-
147
-
148
-
149
-
150
-
151
-
152
-
153
-
154
-
155
-
156
-
157
-
158
-
159
-
160
-
161
-
162
-
163
-
164
-
165
-
166
-
167
-
168
-
169
-
170
-
171
-
172
-
173
-
174
-
175
-
176
-
177
-
178
-
179
-
180
-
181
-
182
-
183
-
184
-
185
-
186
-
187
-
188
-
189
-
190
-
191
-
192
-
193
-
194
-
195
-
196
-
197
-
198
-
199
-
200
-
201
-
202
-
203
-
204
-
205
-
206
-
207
-
208
-
209
 |
 |

Table of Contents
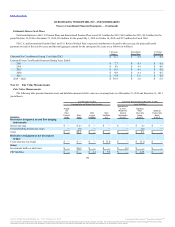
The following table displays the change in the components of accumulated other comprehensive income (loss) (in millions):
Balances at June 30, 2009 $(17.8) $ (15.8) $ (12.3) $ (45.9)
Foreign currency translation adjustment — — (4.4) (4.4)
Net change in fair value of derivatives,net of tax of $2.6 4.1 — — 4.1
Amounts reclassified to earnings during the period from terminated swaps, net of tax of
$0.6 (1.0) — — (1.0)
Pension and post-retirement benefit plans, — — —
net of tax of $11.3 — (19.7) — (19.7)
Balances at June 30, 2010 $(14.7) $ (35.5) $ (16.7) $(66.9)
Foreign currency translation adjustment — — 13.3 13.3
Net change in fair value of derivatives,net of tax of $1.1 1.7 — — 1.7
Amounts reclassified to earnings during the period from terminated swaps, net of tax of
$0.2 (0.2) — — (0.2)
Pension and post-retirement benefit plans,net of tax of $3.1 — 5.8 — 5.8
Balances at October 18, 2010 $(13.2) $ (29.7) $(3.4) $(46.3)
Balances at October 19, 2010 $ — $ — $ — $ —
Foreign currency translation adjustment — — (48.5) (48.5)
Net change in fair value of derivatives,net of tax of $13.9 21.9 — — 21.9
Pension and post-retirement benefit plans,net of tax of $3.9 — 8.8 — 8.8
Balances at December 31, 2010 $21.9 $ 8.8 $ (48.5) $(17.8)
Foreign currency translation adjustment — — (44.3) (44.3)
Net change in fair value of derivatives, net of tax of $26.4 (40.9) — — (40.9)
Amounts reclassified to earnings during the period from terminated caps, net of tax of $0.4 (0.6) — — (0.6)
Pension and post-retirement benefit plans, net of tax of $5.5 — (9.7) — (9.7)
Balances at December 31, 2011 $(19.6) $(0.9) $ (92.8) $(113.3)
Foreign currency translation adjustment — — 15.5 15.5
Net change in fair value of derivatives, net of tax of $10.6 (16.6) — — (16.6)
Amounts reclassified to earnings during the period from terminated caps, net of tax of $4.5 7.0 — — 7.0
Pension and post-retirement benefit plans, net of tax of $0.2 — (1.3) — (1.3)
Amortization of prior service costs, net of tax of $1.0 — (1.6) — (1.6)
Balances at December 31, 2012 $ (29.2) $(3.8) $ (77.3) $(110.3)
116
Source: Burger King Worldwide, Inc., 10-K, February 22, 2013 Powered by Morningstar® Document Research℠
The information contained herein may not be copied, adapted or distributed and is not warranted to be accurate, complete or timely. The user assumes all risks for any damages or losses arising from any use of this
information, except to the extent such damages or losses cannot be limited or excluded by applicable law. Past financial performance is no guarantee of future results.