Burger King 2012 Annual Report Download - page 46
Download and view the complete annual report
Please find page 46 of the 2012 Burger King annual report below. You can navigate through the pages in the report by either clicking on the pages listed below, or by using the keyword search tool below to find specific information within the annual report.-
 1
1 -
2
-
3
-
4
-
5
-
6
-
7
-
8
-
9
-
10
-
11
-
12
-
13
-
14
-
15
-
16
-
17
-
18
-
19
-
20
-
21
-
22
-
23
-
24
-
25
-
26
-
27
-
28
-
29
-
30
-
31
-
32
-
33
-
34
-
35
-
 36
36 -
 37
37 -
 38
38 -
 39
39 -
 40
40 -
 41
41 -
 42
42 -
 43
43 -
 44
44 -
 45
45 -
 46
46 -
 47
47 -
 48
48 -
 49
49 -
 50
50 -
 51
51 -
 52
52 -
 53
53 -
 54
54 -
 55
55 -
 56
56 -
57
-
58
-
59
-
60
-
61
-
62
-
63
-
64
-
65
-
66
-
67
-
68
-
69
-
70
-
71
-
72
-
73
-
74
-
75
-
76
-
77
-
78
-
79
-
80
-
81
-
82
-
83
-
84
-
85
-
86
-
87
-
88
-
89
-
90
-
91
-
92
-
93
-
94
-
95
-
96
-
97
-
98
-
99
-
100
-
101
-
102
-
103
-
104
-
105
-
106
-
107
-
108
-
109
-
110
-
111
-
112
-
113
-
114
-
115
-
116
-
117
-
118
-
119
-
120
-
121
-
122
-
123
-
124
-
125
-
126
-
127
-
128
-
129
-
130
-
131
-
132
-
133
-
134
-
135
-
136
-
137
-
138
-
139
-
140
-
141
-
142
-
143
-
144
-
145
-
146
-
147
-
148
-
149
-
150
-
151
-
152
-
153
-
154
-
155
-
156
-
157
-
158
-
159
-
160
-
161
-
162
-
163
-
164
-
165
-
166
-
167
-
168
-
169
-
170
-
171
-
172
-
173
-
174
-
175
-
176
-
177
-
178
-
179
-
180
-
181
-
182
-
183
-
184
-
185
-
186
-
187
-
188
-
189
-
190
-
191
-
192
-
193
-
194
-
195
-
196
-
197
-
198
-
199
-
200
-
201
-
202
-
203
-
204
-
205
-
206
-
207
-
208
-
209
 |
 |

Table of Contents
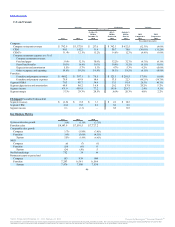
The increases in Adjusted EBITDA in 2012 and 2011 were primarily driven by increases in segment income in all of our operating segments and
reductions in Unallocated Management G&A.
The increase in income from operations in 2012 was driven by the increase in consolidated Adjusted EBITDA, the non-recurrence of costs related to the
2010 Transactions, global restructuring project and field optimization project. These factors were partially offset by increases in global portfolio realignment
project costs, share-based compensation and non-cash incentive compensation expense and other operating (income) expense, net and business combination
agreement expenses. Income from operations was also favorably impacted by reductions in depreciation and amortization expense.
The increase in income from operations in 2011 was driven by the increase in consolidated Adjusted EBITDA and reductions in share-based
compensation and non-cash incentive compensation expense, 2010 Transaction costs and global restructuring and related professional fees. These factors were
partially offset by an increase in depreciation and amortization, primarily as a result of acquisition accounting, as well as field optimization project costs,
global portfolio realignment project costs and a decrease in other operating income, net.
Our net income increased in 2012 primarily as a result of an increase in income from operations and a decrease in interest expense, net, partially offset
by an increase in the loss on early extinguishment of debt and an increase in income tax expense.
Our net income increased in 2011 primarily as a result of an increase in income from operations and a decrease in income tax expense, partially offset by
an increase in interest expense and the loss we recorded on the early extinguishment of debt.
45
Source: Burger King Worldwide, Inc., 10-K, February 22, 2013 Powered by Morningstar® Document Research℠
The information contained herein may not be copied, adapted or distributed and is not warranted to be accurate, complete or timely. The user assumes all risks for any damages or losses arising from any use of this
information, except to the extent such damages or losses cannot be limited or excluded by applicable law. Past financial performance is no guarantee of future results.