Burger King 2012 Annual Report Download - page 107
Download and view the complete annual report
Please find page 107 of the 2012 Burger King annual report below. You can navigate through the pages in the report by either clicking on the pages listed below, or by using the keyword search tool below to find specific information within the annual report.-
 1
1 -
2
-
3
-
4
-
5
-
6
-
7
-
8
-
9
-
10
-
11
-
12
-
13
-
14
-
15
-
16
-
17
-
18
-
19
-
20
-
21
-
22
-
23
-
24
-
25
-
26
-
27
-
28
-
29
-
30
-
31
-
32
-
33
-
34
-
35
-
36
-
37
-
38
-
39
-
40
-
41
-
42
-
43
-
44
-
45
-
46
-
47
-
48
-
49
-
50
-
51
-
52
-
53
-
54
-
55
-
56
-
57
-
58
-
59
-
60
-
61
-
62
-
63
-
64
-
65
-
66
-
67
-
68
-
69
-
70
-
71
-
72
-
73
-
74
-
75
-
76
-
77
-
78
-
79
-
80
-
81
-
82
-
83
-
84
-
85
-
86
-
87
-
88
-
89
-
90
-
91
-
92
-
93
-
94
-
95
-
96
-
 97
97 -
 98
98 -
 99
99 -
 100
100 -
 101
101 -
 102
102 -
 103
103 -
 104
104 -
 105
105 -
 106
106 -
 107
107 -
 108
108 -
 109
109 -
 110
110 -
 111
111 -
 112
112 -
 113
113 -
 114
114 -
 115
115 -
 116
116 -
 117
117 -
118
-
119
-
120
-
121
-
122
-
123
-
124
-
125
-
126
-
127
-
128
-
129
-
130
-
131
-
132
-
133
-
134
-
135
-
136
-
137
-
138
-
139
-
140
-
141
-
142
-
143
-
144
-
145
-
146
-
147
-
148
-
149
-
150
-
151
-
152
-
153
-
154
-
155
-
156
-
157
-
158
-
159
-
160
-
161
-
162
-
163
-
164
-
165
-
166
-
167
-
168
-
169
-
170
-
171
-
172
-
173
-
174
-
175
-
176
-
177
-
178
-
179
-
180
-
181
-
182
-
183
-
184
-
185
-
186
-
187
-
188
-
189
-
190
-
191
-
192
-
193
-
194
-
195
-
196
-
197
-
198
-
199
-
200
-
201
-
202
-
203
-
204
-
205
-
206
-
207
-
208
-
209
 |
 |

Table of Contents
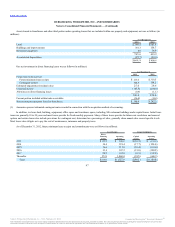
Benefit obligation at end of year $ 32.5 $30.0
Fair value of plan assets at end of year 23.3 21.1
$ (9.2) $ (8.9)
Noncurrent Assets $1.6 $ —
Current liabilities — —
Noncurrent liabilities (10.8) (8.9)
Net pension liability, end of fiscal year $ (9.2) $ (8.9)
Unrecognized actuarial loss (gain) $(1.2) $ (1.5)
Total AOCI (before tax) $(1.2) $ (1.5)
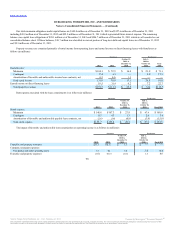
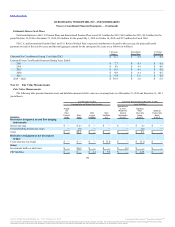
The following sets forth the projected benefit obligation, accumulated benefit obligation and fair value of plan assets for the U.S. Pension Plans,
International Pension Plans and U.S. Retiree Medical Plan with accumulated benefit obligations in excess of plan assets (in millions):
Projected benefit obligation $212.9 $193.0 $8.5 $19.5 $ 32.5 $30.0
Accumulated benefit obligation $212.9 $193.0 $8.5 $19.5 $26.2 $ 21.2
Fair value of plan assets $145.4 $129.0 $ — $ — $23.3 $ 21.1
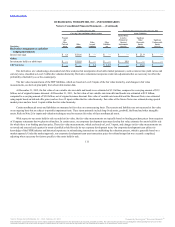
The net periodic benefit costs for the U.S. Pension Plans and U.S. Retiree Medical Plan and International Pension Plans did not exceed $2.0 million in
any comparative period.
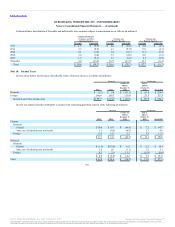
Unrecognized actuarial (gain) loss $12.0 $21.6 $(8.2) $(6.5) $ 23.9
(Gain) loss recognized due to settlement (0.2) (0.4) — — —
Prior service cost (credit) — — — — —
Amortization of prior service cost (credit) — — — — —
Recognized net actuarial gain (loss) — — — (0.7) —
Total recognized in OCI $11.8 $ 21.2 $(8.2) $(7.2) $ 23.9
106
Source: Burger King Worldwide, Inc., 10-K, February 22, 2013 Powered by Morningstar® Document Research℠
The information contained herein may not be copied, adapted or distributed and is not warranted to be accurate, complete or timely. The user assumes all risks for any damages or losses arising from any use of this
information, except to the extent such damages or losses cannot be limited or excluded by applicable law. Past financial performance is no guarantee of future results.