Burger King 2012 Annual Report Download - page 73
Download and view the complete annual report
Please find page 73 of the 2012 Burger King annual report below. You can navigate through the pages in the report by either clicking on the pages listed below, or by using the keyword search tool below to find specific information within the annual report.-
 1
1 -
2
-
3
-
4
-
5
-
6
-
7
-
8
-
9
-
10
-
11
-
12
-
13
-
14
-
15
-
16
-
17
-
18
-
19
-
20
-
21
-
22
-
23
-
24
-
25
-
26
-
27
-
28
-
29
-
30
-
31
-
32
-
33
-
34
-
35
-
36
-
37
-
38
-
39
-
40
-
41
-
42
-
43
-
44
-
45
-
46
-
47
-
48
-
49
-
50
-
51
-
52
-
53
-
54
-
55
-
56
-
57
-
58
-
59
-
60
-
61
-
62
-
 63
63 -
 64
64 -
 65
65 -
 66
66 -
 67
67 -
 68
68 -
 69
69 -
 70
70 -
 71
71 -
 72
72 -
 73
73 -
 74
74 -
 75
75 -
 76
76 -
 77
77 -
 78
78 -
 79
79 -
 80
80 -
 81
81 -
 82
82 -
 83
83 -
84
-
85
-
86
-
87
-
88
-
89
-
90
-
91
-
92
-
93
-
94
-
95
-
96
-
97
-
98
-
99
-
100
-
101
-
102
-
103
-
104
-
105
-
106
-
107
-
108
-
109
-
110
-
111
-
112
-
113
-
114
-
115
-
116
-
117
-
118
-
119
-
120
-
121
-
122
-
123
-
124
-
125
-
126
-
127
-
128
-
129
-
130
-
131
-
132
-
133
-
134
-
135
-
136
-
137
-
138
-
139
-
140
-
141
-
142
-
143
-
144
-
145
-
146
-
147
-
148
-
149
-
150
-
151
-
152
-
153
-
154
-
155
-
156
-
157
-
158
-
159
-
160
-
161
-
162
-
163
-
164
-
165
-
166
-
167
-
168
-
169
-
170
-
171
-
172
-
173
-
174
-
175
-
176
-
177
-
178
-
179
-
180
-
181
-
182
-
183
-
184
-
185
-
186
-
187
-
188
-
189
-
190
-
191
-
192
-
193
-
194
-
195
-
196
-
197
-
198
-
199
-
200
-
201
-
202
-
203
-
204
-
205
-
206
-
207
-
208
-
209
 |
 |

Table of Contents
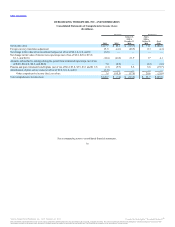
Net income (loss) $117.7 $ 88.1 $(115.7) $ 71.1 $186.8
Adjustments to reconcile net income (loss) to net cash provided by operating activities:
Depreciation and amortization 114.2 136.4 27.6 31.2 111.7
Transaction costs — — 17.2 — —
Loss on early extinguishment of debt 34.2 21.1 — — —
Amortization of deferred financing costs and debt issuance discount 57.0 46.3 2.6 0.6 2.1
Equity in net loss from unconsolidated affiliates 4.1 1.2 0.3 0.5 0.1
(Gain) loss on remeasurement of foreign denominated transactions (8.2) 0.4 (3.2) (41.5) 40.9
Amortization of prior service costs (2.5) — — — —
Realized loss (gain) on terminated caps/swaps 11.8 0.5 — (0.4) (1.6)
Loss (gain) on refranchisings and dispositions of assets 27.0 (1.0) 0.8 (4.6) (9.5)
Impairment on non-restaurant properties — 2.3 0.6 0.1 2.9
Bad debt expense (recoveries), net (0.8) 6.1 2.8 2.1 0.8
Share-based compensation and non-cash incentive compensation expense 12.2 6.4 — 5.8 17.0
Deferred income taxes 8.9 (27.3) (12.9) (1.4) 16.9
Changes in current assets and liabilities, excluding acquisitions and dispositions:
Trade and notes receivable (22.2) (6.0) (32.5) 32.0 (15.9)
Prepaids and other current assets (7.0) 105.5 (70.6) (2.2) (1.4)
Accounts and drafts payable (23.9) 8.7 (26.5) 9.0 (20.8)
Accrued advertising (32.3) 18.3 6.8 1.3 6.4
Other accrued liabilities (40.3) 16.0 58.1 29.4 (22.3)
Other long-term assets and liabilities (25.5) (16.8) 18.1 (11.7) (3.7)
Net cash provided by (used for) operating activities 224.4 406.2 (126.5) 121.3 310.4
Payments for property and equipment (70.2) (82.1) (28.4) (18.2) (150.3)
Proceeds from refranchisings, disposition of asset and restaurant closures 104.9 29.9 5.7 9.6 21.5
Investments in / advances to unconsolidated affiliates — (4.5) — — —
Payments for acquired franchisee operations, net of cash acquired (15.3) — — — (14.0)
Return of investment on direct financing leases 14.2 14.6 2.1 2.6 8.2
Other investing activities — 0.7 1.4 1.2 (0.3)
Net payment for purchase of BKH — — (3,325.4) — —
Net cash provided by (used for) investing activities 33.6 (41.4) (3,344.6) (4.8) (134.9)
72
Source: Burger King Worldwide, Inc., 10-K, February 22, 2013 Powered by Morningstar® Document Research℠
The information contained herein may not be copied, adapted or distributed and is not warranted to be accurate, complete or timely. The user assumes all risks for any damages or losses arising from any use of this
information, except to the extent such damages or losses cannot be limited or excluded by applicable law. Past financial performance is no guarantee of future results.