Burger King 2012 Annual Report Download - page 112
Download and view the complete annual report
Please find page 112 of the 2012 Burger King annual report below. You can navigate through the pages in the report by either clicking on the pages listed below, or by using the keyword search tool below to find specific information within the annual report.-
 1
1 -
2
-
3
-
4
-
5
-
6
-
7
-
8
-
9
-
10
-
11
-
12
-
13
-
14
-
15
-
16
-
17
-
18
-
19
-
20
-
21
-
22
-
23
-
24
-
25
-
26
-
27
-
28
-
29
-
30
-
31
-
32
-
33
-
34
-
35
-
36
-
37
-
38
-
39
-
40
-
41
-
42
-
43
-
44
-
45
-
46
-
47
-
48
-
49
-
50
-
51
-
52
-
53
-
54
-
55
-
56
-
57
-
58
-
59
-
60
-
61
-
62
-
63
-
64
-
65
-
66
-
67
-
68
-
69
-
70
-
71
-
72
-
73
-
74
-
75
-
76
-
77
-
78
-
79
-
80
-
81
-
82
-
83
-
84
-
85
-
86
-
87
-
88
-
89
-
90
-
91
-
92
-
93
-
94
-
95
-
96
-
97
-
98
-
99
-
100
-
101
-
 102
102 -
 103
103 -
 104
104 -
 105
105 -
 106
106 -
 107
107 -
 108
108 -
 109
109 -
 110
110 -
 111
111 -
 112
112 -
 113
113 -
 114
114 -
 115
115 -
 116
116 -
 117
117 -
 118
118 -
 119
119 -
 120
120 -
 121
121 -
 122
122 -
123
-
124
-
125
-
126
-
127
-
128
-
129
-
130
-
131
-
132
-
133
-
134
-
135
-
136
-
137
-
138
-
139
-
140
-
141
-
142
-
143
-
144
-
145
-
146
-
147
-
148
-
149
-
150
-
151
-
152
-
153
-
154
-
155
-
156
-
157
-
158
-
159
-
160
-
161
-
162
-
163
-
164
-
165
-
166
-
167
-
168
-
169
-
170
-
171
-
172
-
173
-
174
-
175
-
176
-
177
-
178
-
179
-
180
-
181
-
182
-
183
-
184
-
185
-
186
-
187
-
188
-
189
-
190
-
191
-
192
-
193
-
194
-
195
-
196
-
197
-
198
-
199
-
200
-
201
-
202
-
203
-
204
-
205
-
206
-
207
-
208
-
209
 |
 |

Table of Contents
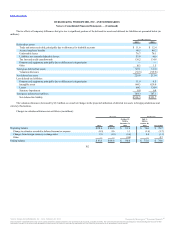
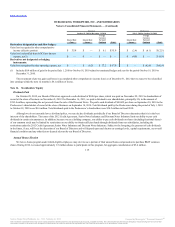
Interest rate caps $ 3.3 $18.6 $ — $ — $ — $21.9 $ —
Investments held in a rabbi trust $ — $10.8 $ — $ — $ 10.8 $ — $ —
ERP liabilities $ — $ — $ 3.4 $ 12.8 $ — $16.2 $ —
Our derivatives are valued using a discounted cash flow analysis that incorporates observable market parameters, such as interest rate yield curves and
currency rates, classified as Level 2 within the valuation hierarchy. Derivative valuations incorporate credit risk adjustments that are necessary to reflect the
probability of default by us or the counterparty.
The fair value measurements of the ERP liabilities, which are based on Level 2 inputs of the fair value hierarchy, and changes in fair value
measurements, are derived principally from observable market data.
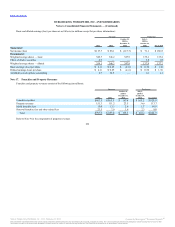
At December 31, 2012, the fair value of our variable rate term debt and bonds were estimated at $3.1 billion, compared to a carrying amount of $2.9
billion, net of original issuance discount. At December 31, 2011, the fair value of our variable rate term debt and bonds was estimated at $2.9 billion,
compared to a carrying amount of $3.0 billion, net of original issuance discount. Fair value of variable rate term debt and the Discount Notes was estimated
using inputs based on bid and offer prices and are Level 2 inputs within the fair value hierarchy. Fair value of the Senior Notes was estimated using quoted
market prices and are Level 1 inputs within the fair value hierarchy.
Certain nonfinancial assets and liabilities are measured at fair value on a nonrecurring basis. These assets and liabilities are not measured at fair value
on an ongoing basis but are subject to periodic impairment tests. These items primarily include long-lived assets, goodwill, the Brand and other intangible
assets. Refer to Note 2 for inputs and valuation techniques used to measure fair value of these nonfinancial assets.
With respect to our assets held for sale recorded at fair value, the fair value measurements are typically based on binding purchase prices from acquirers
of Company restaurants that we plan to refranchise. In certain cases, our corporate development team may develop fair value estimates for assets held for sale
for which there is no binding purchase price. These fair value measurements, which are based on Level 3 inputs, and changes in fair value measurements are
reviewed and assessed each quarter for assets classified as held for sale by our corporate development team. Our corporate development team utilizes its
knowledge of the FFHR industry and historical experience in refranchising transactions in establishing the valuation process, which is generally based on a
market approach. Under the market approach, our corporate development team uses transaction prices for refranchisings that were recently completed,
adjusting where necessary for factors specific to the assets held for sale.
111
Source: Burger King Worldwide, Inc., 10-K, February 22, 2013 Powered by Morningstar® Document Research℠
The information contained herein may not be copied, adapted or distributed and is not warranted to be accurate, complete or timely. The user assumes all risks for any damages or losses arising from any use of this
information, except to the extent such damages or losses cannot be limited or excluded by applicable law. Past financial performance is no guarantee of future results.