Burger King 2012 Annual Report Download - page 77
Download and view the complete annual report
Please find page 77 of the 2012 Burger King annual report below. You can navigate through the pages in the report by either clicking on the pages listed below, or by using the keyword search tool below to find specific information within the annual report.-
 1
1 -
2
-
3
-
4
-
5
-
6
-
7
-
8
-
9
-
10
-
11
-
12
-
13
-
14
-
15
-
16
-
17
-
18
-
19
-
20
-
21
-
22
-
23
-
24
-
25
-
26
-
27
-
28
-
29
-
30
-
31
-
32
-
33
-
34
-
35
-
36
-
37
-
38
-
39
-
40
-
41
-
42
-
43
-
44
-
45
-
46
-
47
-
48
-
49
-
50
-
51
-
52
-
53
-
54
-
55
-
56
-
57
-
58
-
59
-
60
-
61
-
62
-
63
-
64
-
65
-
66
-
 67
67 -
 68
68 -
 69
69 -
 70
70 -
 71
71 -
 72
72 -
 73
73 -
 74
74 -
 75
75 -
 76
76 -
 77
77 -
 78
78 -
 79
79 -
 80
80 -
 81
81 -
 82
82 -
 83
83 -
 84
84 -
 85
85 -
 86
86 -
 87
87 -
88
-
89
-
90
-
91
-
92
-
93
-
94
-
95
-
96
-
97
-
98
-
99
-
100
-
101
-
102
-
103
-
104
-
105
-
106
-
107
-
108
-
109
-
110
-
111
-
112
-
113
-
114
-
115
-
116
-
117
-
118
-
119
-
120
-
121
-
122
-
123
-
124
-
125
-
126
-
127
-
128
-
129
-
130
-
131
-
132
-
133
-
134
-
135
-
136
-
137
-
138
-
139
-
140
-
141
-
142
-
143
-
144
-
145
-
146
-
147
-
148
-
149
-
150
-
151
-
152
-
153
-
154
-
155
-
156
-
157
-
158
-
159
-
160
-
161
-
162
-
163
-
164
-
165
-
166
-
167
-
168
-
169
-
170
-
171
-
172
-
173
-
174
-
175
-
176
-
177
-
178
-
179
-
180
-
181
-
182
-
183
-
184
-
185
-
186
-
187
-
188
-
189
-
190
-
191
-
192
-
193
-
194
-
195
-
196
-
197
-
198
-
199
-
200
-
201
-
202
-
203
-
204
-
205
-
206
-
207
-
208
-
209
 |
 |

Table of Contents
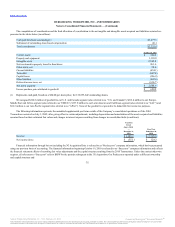
the application of acquisition accounting affects the comparability of results of operations for periods before and after the 3G Acquisition. Black lines have
been drawn to separate the Successor’s financial information from that of our Predecessor.
The consolidated financial statements include our accounts and the accounts of our wholly-owned subsidiaries. Investments in affiliates owned 50% or
less and variable interest entities (“VIEs”) in which we are not deemed to be the primary beneficiary are accounted for by the equity method. All material
intercompany balances and transactions have been eliminated in consolidation.
We have investments in certain franchisee entities that are VIEs. We are required to consolidate VIEs where we have determined that we are the primary
beneficiary. The primary beneficiary is the entity that possesses the power to direct the activities of the VIE that most significantly impact its economic
performance and has the obligation to absorb losses or the right to receive benefits from the VIE that are significant to it. The principal entities in which we
possess a variable interest are accounted for under the equity method, as we have determined we are not the primary beneficiary. Royalties, franchise fees and
rents received from equity method investees were not material to our consolidated statements of operations or cash flows during 2012, 2011, the period of
October 19, 2010 to December 31, 2010, the period of July 1, 2010 to October 18, 2010 or fiscal 2010 and amounts due from equity method investees as of
December 31, 2012 and 2011 were not material.
Certain prior year amounts in the consolidated financial statements and accompanying notes have been reclassified in order to be comparable with the
current year classifications. These reclassifications had no effect on previously reported net income (loss).
Our operations include Company and franchise restaurants located in 86 countries and U.S. territories. Of the 12,997 restaurants in operation as of
December 31, 2012, 418 were Company restaurants and 12,579 were franchise restaurants.
Four distributors currently service approximately 85% of our U.S. system restaurants and the loss of any one of these distributors would likely
adversely affect our business. In many of our international markets, a single distributor services all the restaurants in the market. The loss of
any of one of these distributors would likely have an adverse effect on the market impacted, and depending on the market, could have an adverse impact on
our financial results. In addition, we are moving to a business model in which we enter into exclusive agreements with master franchisees to develop and
operate restaurants, and subfranchise to third parties the right to develop and operate restaurants in defined geographic areas. The termination of an
arrangement with a master franchisee or a lack of expansion by certain master franchisees could result in the delay or discontinuation of the development of
franchise restaurants, or an interruption in the operation of our brand in a particular market or markets.
The preparation of financial statements in conformity with accounting principles generally accepted in the United States (“GAAP”) requires management
to make estimates and assumptions that affect the amounts reported in our consolidated financial statements and accompanying notes. Management adjusts
such estimates
76
Source: Burger King Worldwide, Inc., 10-K, February 22, 2013 Powered by Morningstar® Document Research℠
The information contained herein may not be copied, adapted or distributed and is not warranted to be accurate, complete or timely. The user assumes all risks for any damages or losses arising from any use of this
information, except to the extent such damages or losses cannot be limited or excluded by applicable law. Past financial performance is no guarantee of future results.