BMW 2005 Annual Report Download - page 93
Download and view the complete annual report
Please find page 93 of the 2005 BMW annual report below. You can navigate through the pages in the report by either clicking on the pages listed below, or by using the keyword search tool below to find specific information within the annual report.-
 1
1 -
2
-
3
-
4
-
5
-
6
-
7
-
8
-
9
-
10
-
11
-
12
-
13
-
14
-
15
-
16
-
17
-
18
-
19
-
20
-
21
-
22
-
23
-
24
-
25
-
26
-
27
-
28
-
29
-
30
-
31
-
32
-
33
-
34
-
35
-
36
-
37
-
38
-
39
-
40
-
41
-
42
-
43
-
44
-
45
-
46
-
47
-
48
-
49
-
50
-
51
-
52
-
53
-
54
-
55
-
56
-
57
-
58
-
59
-
60
-
61
-
62
-
63
-
64
-
65
-
66
-
67
-
68
-
69
-
70
-
71
-
72
-
73
-
74
-
75
-
76
-
77
-
78
-
79
-
80
-
81
-
82
-
 83
83 -
 84
84 -
 85
85 -
 86
86 -
 87
87 -
 88
88 -
 89
89 -
 90
90 -
 91
91 -
 92
92 -
 93
93 -
 94
94 -
 95
95 -
 96
96 -
 97
97 -
 98
98 -
 99
99 -
 100
100 -
 101
101 -
 102
102 -
 103
103 -
104
-
105
-
106
-
107
-
108
-
109
-
110
-
111
-
112
-
113
-
114
-
115
-
116
-
117
-
118
-
119
-
120
-
121
-
122
-
123
-
124
-
125
-
126
-
127
-
128
-
129
-
130
-
131
-
132
-
133
-
134
-
135
-
136
-
137
-
138
-
139
-
140
-
141
-
142
-
143
-
144
-
145
-
146
-
147
-
148
-
149
-
150
-
151
-
152
-
153
-
154
-
155
-
156
-
157
-
158
-
159
-
160
-
161
-
162
-
163
-
164
-
165
-
166
-
167
-
168
-
169
-
170
-
171
-
172
-
173
-
174
-
175
-
176
-
177
-
178
-
179
-
180
-
181
-
182
-
183
-
184
-
185
-
186
-
187
-
188
-
189
-
190
-
191
-
192
-
193
-
194
-
195
-
196
-
197
-
198
-
199
-
200
-
201
-
202
-
203
-
204
-
205
 |
 |

92
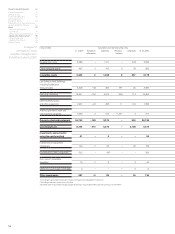
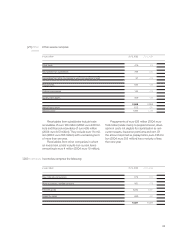
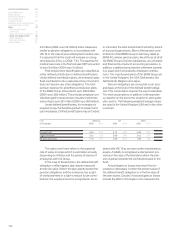
Analysis of
changes in Group
tangible, intangible and
investment assets 2004
in euro million Acquisition and manufacturing costs
1.1.20041]Translation Additions Reclassi- Disposals 31.12.2004
differences fications
1]including the gross balances brought forward of companies consolidated for the first time
2]including impairment losses of euro16 million
3]total fair value measurement changes recognised directly in accumulated other equity amounted to euro 154 million
Development costs 4,898 – 1,121 – 423 5,596
Other intangible assets 467 2 147 0 34 582
Intangible assets 5,365 2 1,268 0 457 6,178
Land, titles to land, buildings,
including buildings on
third party land 4,826 – 40 303 497 26 5,560
Plant and machinery 16,327 –102 2,013 939 714 18,463
Other facilities, factory
and office equipment 1,907 – 20 250 11 192 1,956
Advance payments made and
construction in progress 1,693 2 513 –1,447 4 757
Property, plant and equipment 24,753 – 160 3,079 – 936 26,736
Leased products 8,246 – 615 5,372 – 3,728 9,275
Investments accounted for
using the equity method 61 – 4 – – 65
Investments in associated
companies 148 –1 33 – 30 150
Investments in other companies 522 – 423] – – 564
Non-current marketable
securities 15 –1 9 – 3 20
Other non-current loans receivable 2–––20
Other investments 687 – 2 84 – 35 734
Group Financial Statements 62
Income Statements 63
Balance Sheets 64
Cash Flow Statements 66
Group Statement of
Changes in Equity 68
Statement of Income and Expenses
recognised directly in Equity 69
Notes 70
--Accounting Principles
and Policies 70
--Notes to the Income Statement 81
--Notes to the balance sheet 90
--Other Disclosures 114
--Segment Information 121
Auditors’ Report 125