BMW 2005 Annual Report Download - page 68
Download and view the complete annual report
Please find page 68 of the 2005 BMW annual report below. You can navigate through the pages in the report by either clicking on the pages listed below, or by using the keyword search tool below to find specific information within the annual report.-
 1
1 -
2
-
3
-
4
-
5
-
6
-
7
-
8
-
9
-
10
-
11
-
12
-
13
-
14
-
15
-
16
-
17
-
18
-
19
-
20
-
21
-
22
-
23
-
24
-
25
-
26
-
27
-
28
-
29
-
30
-
31
-
32
-
33
-
34
-
35
-
36
-
37
-
38
-
39
-
40
-
41
-
42
-
43
-
44
-
45
-
46
-
47
-
48
-
49
-
50
-
51
-
52
-
53
-
54
-
55
-
56
-
57
-
 58
58 -
 59
59 -
 60
60 -
 61
61 -
 62
62 -
 63
63 -
 64
64 -
 65
65 -
 66
66 -
 67
67 -
 68
68 -
 69
69 -
 70
70 -
 71
71 -
 72
72 -
 73
73 -
 74
74 -
 75
75 -
 76
76 -
 77
77 -
 78
78 -
79
-
80
-
81
-
82
-
83
-
84
-
85
-
86
-
87
-
88
-
89
-
90
-
91
-
92
-
93
-
94
-
95
-
96
-
97
-
98
-
99
-
100
-
101
-
102
-
103
-
104
-
105
-
106
-
107
-
108
-
109
-
110
-
111
-
112
-
113
-
114
-
115
-
116
-
117
-
118
-
119
-
120
-
121
-
122
-
123
-
124
-
125
-
126
-
127
-
128
-
129
-
130
-
131
-
132
-
133
-
134
-
135
-
136
-
137
-
138
-
139
-
140
-
141
-
142
-
143
-
144
-
145
-
146
-
147
-
148
-
149
-
150
-
151
-
152
-
153
-
154
-
155
-
156
-
157
-
158
-
159
-
160
-
161
-
162
-
163
-
164
-
165
-
166
-
167
-
168
-
169
-
170
-
171
-
172
-
173
-
174
-
175
-
176
-
177
-
178
-
179
-
180
-
181
-
182
-
183
-
184
-
185
-
186
-
187
-
188
-
189
-
190
-
191
-
192
-
193
-
194
-
195
-
196
-
197
-
198
-
199
-
200
-
201
-
202
-
203
-
204
-
205
 |
 |

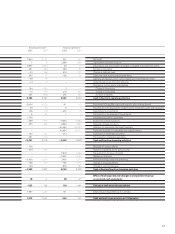
67
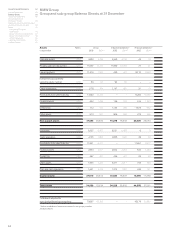
Industrial operations1] Financial operations1]
2005 20042] 2005 20042]
1,954 2,001 527 449 Net profit
552,899 2,390 Depreciation of leased products
2,997 2,660 28 15 Depreciation and amortisation of tangible, intangible and investment assets
441 653 304 98 Increase in provisions
–54 482 418 111 Change in deferred taxes
342 43 –166 32 Other non-cash income and expense items
–99 19 ––Gain/loss on disposal of non-current assets and marketable securities
–14 –4 ––Undistributed results from joint ventures
Changes in current assets and liabilities
184 – 864 3–1 Change in inventories
–73 472 218 – 344 Change in receivables
501 690 276 404 Increase in liabilities
6,184 6,157 4,507 3,154 Cash inflow from operating activities
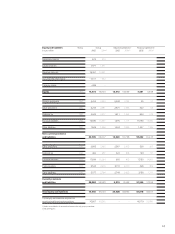
– 3,834 – 4,225 –41 –18 Investment in intangible assets and property, plant and equipment
39 40 32
Proceeds from the disposal of intangible assets and property, plant and equipment
138 –34 – 212 –9 Expenditure for investments
631 73Proceeds from the disposal of investments
1,000 –––Proceeds from sale of Land Rover
– 369 – 337 – 9,092 – 6,990 Investment in leased products
355 336 2,842 2,861 Disposals of leased products
––– 45,365 – 38,432 Additions to receivables from sales financing
––42,634 34,741 Payments received on receivables from sales financing
– 183 – 241 – 272 –Investment in marketable securities
381 315 ––Proceeds from marketable securities
– 2,467 – 4,115 – 9,496 – 7,842 Cash outflow from investing activities
– 506 –––Buy-back of treasury shares
– 419 – 392 ––Payment of dividend for the previous year
––5,819 4,339 Proceeds from the issue of bonds
––– 3,432 – 3,126 Repayment of bonds
– 3,456 –1,074 3,456 1,074 Internal financing of financial operations
– 108 175 – 106 1,276 Change in financial liabilities
129 –– 678 865 Change in commercial paper
– 4,360 – 1,291 5,059 4,428 Cash inflow/outflow from financing activities
Effect of exchange rate and changes in composition of group
18 –1 48 –21 on cash and cash equivalents
– 625 750 118 – 281 Change in cash and cash equivalents
1,997 1,247 131 412 Cash and cash equivalents as at 1 January
1,372 1,997 249 131 Cash and cash equivalents as at 31 December