BMW 2005 Annual Report Download - page 51
Download and view the complete annual report
Please find page 51 of the 2005 BMW annual report below. You can navigate through the pages in the report by either clicking on the pages listed below, or by using the keyword search tool below to find specific information within the annual report.-
 1
1 -
2
-
3
-
4
-
5
-
6
-
7
-
8
-
9
-
10
-
11
-
12
-
13
-
14
-
15
-
16
-
17
-
18
-
19
-
20
-
21
-
22
-
23
-
24
-
25
-
26
-
27
-
28
-
29
-
30
-
31
-
32
-
33
-
34
-
35
-
36
-
37
-
38
-
39
-
40
-
 41
41 -
 42
42 -
 43
43 -
 44
44 -
 45
45 -
 46
46 -
 47
47 -
 48
48 -
 49
49 -
 50
50 -
 51
51 -
 52
52 -
 53
53 -
 54
54 -
 55
55 -
 56
56 -
 57
57 -
 58
58 -
 59
59 -
 60
60 -
 61
61 -
62
-
63
-
64
-
65
-
66
-
67
-
68
-
69
-
70
-
71
-
72
-
73
-
74
-
75
-
76
-
77
-
78
-
79
-
80
-
81
-
82
-
83
-
84
-
85
-
86
-
87
-
88
-
89
-
90
-
91
-
92
-
93
-
94
-
95
-
96
-
97
-
98
-
99
-
100
-
101
-
102
-
103
-
104
-
105
-
106
-
107
-
108
-
109
-
110
-
111
-
112
-
113
-
114
-
115
-
116
-
117
-
118
-
119
-
120
-
121
-
122
-
123
-
124
-
125
-
126
-
127
-
128
-
129
-
130
-
131
-
132
-
133
-
134
-
135
-
136
-
137
-
138
-
139
-
140
-
141
-
142
-
143
-
144
-
145
-
146
-
147
-
148
-
149
-
150
-
151
-
152
-
153
-
154
-
155
-
156
-
157
-
158
-
159
-
160
-
161
-
162
-
163
-
164
-
165
-
166
-
167
-
168
-
169
-
170
-
171
-
172
-
173
-
174
-
175
-
176
-
177
-
178
-
179
-
180
-
181
-
182
-
183
-
184
-
185
-
186
-
187
-
188
-
189
-
190
-
191
-
192
-
193
-
194
-
195
-
196
-
197
-
198
-
199
-
200
-
201
-
202
-
203
-
204
-
205
 |
 |

50
Group Management Report 8
A Review of the Financial Year 8
The General Economic Environment 11
Review of operations 15
BMW Stock in 2005 38
Financial Analysis 41
--Internal Management System 41
--Earnings performance 42
--Financial position 45
--Net assets position 46
--Subsequent events report 49
--Value added statement 49
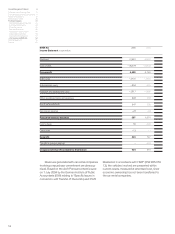
--Key performance figures 51
--Comments on BMW AG 52
Risk Management 56
Outlook 60
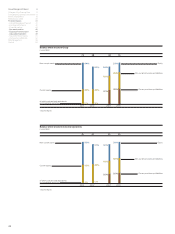
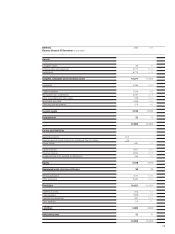
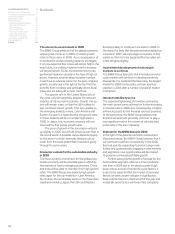
BMW Group value added 2005
in %
Net value added
Cost of materials
Depreciation and amortisation
Other expenses
10.48.9
54.3
26.4
58.5 %
10.9 %
12.7 %
3.4 %
14.5 %
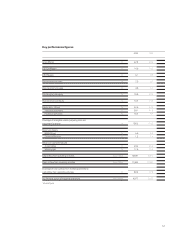
in euro million 2005 2005 2004*2004 Change
in % in % in %
Work performed
Revenues 46,656 98.6 44,335 97.7
Financial income –188 – 0.4 54 0.1
Other income 844 1.8 980 2.2
Total Group output 47,312 100.0 45,369 100.0 4.3
Cost of materials 25,694 54.3 24,467 53.9
Other expenses 4,925 10.4 5,093 11.3
Bought-in costs 30,619 64.7 29,560 65.2 3.6
Gross value added 16,693 35.3 15,809 34.8 5.6
Depreciation and amortisation 4,207 8.9 3,589 7.9
Net value added 12,486 26.4 12,220 26.9 2.2
Applied to:
Employees 7,306 58.5 7,125 58.3 2.5
Providers of finance 1,351 10.9 1,059 8.7 27.6
Government/public sector 1,590 12.7 1,794 14.7 –11.4
Shareholders 424 3.4 419 3.4 1.2
Group 1,815 14.5 1,823 14.9 – 0.4
Net value added 12,486 100.0 12,220 100.0 2.2
BMW Group value added statement
*adjusted figures
Employees
Providers of finance
Government/public sector
Shareholders
Group