BMW 2005 Annual Report Download - page 44
Download and view the complete annual report
Please find page 44 of the 2005 BMW annual report below. You can navigate through the pages in the report by either clicking on the pages listed below, or by using the keyword search tool below to find specific information within the annual report.-
 1
1 -
2
-
3
-
4
-
5
-
6
-
7
-
8
-
9
-
10
-
11
-
12
-
13
-
14
-
15
-
16
-
17
-
18
-
19
-
20
-
21
-
22
-
23
-
24
-
25
-
26
-
27
-
28
-
29
-
30
-
31
-
32
-
33
-
 34
34 -
 35
35 -
 36
36 -
 37
37 -
 38
38 -
 39
39 -
 40
40 -
 41
41 -
 42
42 -
 43
43 -
 44
44 -
 45
45 -
 46
46 -
 47
47 -
 48
48 -
 49
49 -
 50
50 -
 51
51 -
 52
52 -
 53
53 -
 54
54 -
55
-
56
-
57
-
58
-
59
-
60
-
61
-
62
-
63
-
64
-
65
-
66
-
67
-
68
-
69
-
70
-
71
-
72
-
73
-
74
-
75
-
76
-
77
-
78
-
79
-
80
-
81
-
82
-
83
-
84
-
85
-
86
-
87
-
88
-
89
-
90
-
91
-
92
-
93
-
94
-
95
-
96
-
97
-
98
-
99
-
100
-
101
-
102
-
103
-
104
-
105
-
106
-
107
-
108
-
109
-
110
-
111
-
112
-
113
-
114
-
115
-
116
-
117
-
118
-
119
-
120
-
121
-
122
-
123
-
124
-
125
-
126
-
127
-
128
-
129
-
130
-
131
-
132
-
133
-
134
-
135
-
136
-
137
-
138
-
139
-
140
-
141
-
142
-
143
-
144
-
145
-
146
-
147
-
148
-
149
-
150
-
151
-
152
-
153
-
154
-
155
-
156
-
157
-
158
-
159
-
160
-
161
-
162
-
163
-
164
-
165
-
166
-
167
-
168
-
169
-
170
-
171
-
172
-
173
-
174
-
175
-
176
-
177
-
178
-
179
-
180
-
181
-
182
-
183
-
184
-
185
-
186
-
187
-
188
-
189
-
190
-
191
-
192
-
193
-
194
-
195
-
196
-
197
-
198
-
199
-
200
-
201
-
202
-
203
-
204
-
205
 |
 |

43
the increase was, however, lower than that of rev-
enues. They represented 10.2% of revenues, and
were therefore 0.3 percentage points lower on a
year-on-year comparison.
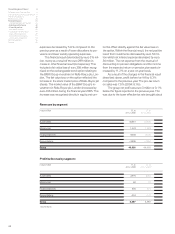
Research and development costs were 5.6%
higher than in 2004, unchanged as a percentage of
revenues at 5.3%. Research and development costs
include amortisation of capitalised development
costs amounting to euro 745 million (2004: euro
637 million). Total research and development costs
amounted to euro 3,115 million (2004: euro 2,818
million). This figure comprises research costs, de-
velopment costs not recognised as assets and capi-
talised development costs. The research and de-
velopment expenditure ratio for 2005 was 6.7%
(2004: 6.4%).
Depreciation and amortisation of property, plant
and equipment and intangible assets included in
cost of sales, sales and administrative costs and re-
search and development costs amounted to euro
3,025 million (2004: euro 2,672 million).
The positive net amount from other operating
income and expenses fell by 23.0% compared
to the previous year. Other operating income de-
creased primarily as a result of lower income from
the reversal of write-downs, reflecting lower credits
from unwinding interest, and the decrease in sundry
operating income. By contrast, income from the
reversal of provisions increased, partly as the result
of reversing a provision relating to the Rover disen-
gagement. The income from this release is included
within the Reconciliations segment. Other operating
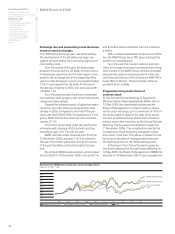
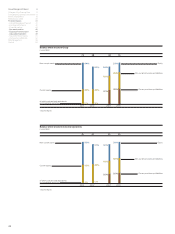
– All brands achieve new sales volume highs
– Adverse external factors hold down reported
earnings
– Group and segment earnings still at high level
–
Operating cash flow well ahead of the previous year
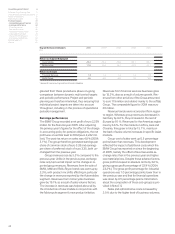
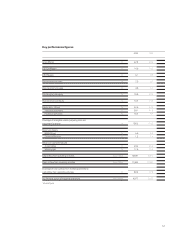
Revenues 46,656 44,335
Cost of sales – 35,992 – 34,040
Gross profit 10,664 10,295
Sales and administrative costs – 4,762 – 4,648
Research and development costs – 2,464 – 2,334
Other operating income and expenses 355 461
Profit before financial result 3,793 3,774
Financial result – 506 – 191
Profit before tax 3,287 3,583
Income taxes – 1,048 – 1,341
Net profit 2,239 2,242
in euro million 1.1. to 1.1. to
31.12. 2005 31.12. 2004 *
Group Income Statement
*adjusted figures