BMW 2005 Annual Report Download - page 47
Download and view the complete annual report
Please find page 47 of the 2005 BMW annual report below. You can navigate through the pages in the report by either clicking on the pages listed below, or by using the keyword search tool below to find specific information within the annual report.-
 1
1 -
2
-
3
-
4
-
5
-
6
-
7
-
8
-
9
-
10
-
11
-
12
-
13
-
14
-
15
-
16
-
17
-
18
-
19
-
20
-
21
-
22
-
23
-
24
-
25
-
26
-
27
-
28
-
29
-
30
-
31
-
32
-
33
-
34
-
35
-
36
-
 37
37 -
 38
38 -
 39
39 -
 40
40 -
 41
41 -
 42
42 -
 43
43 -
 44
44 -
 45
45 -
 46
46 -
 47
47 -
 48
48 -
 49
49 -
 50
50 -
 51
51 -
 52
52 -
 53
53 -
 54
54 -
 55
55 -
 56
56 -
 57
57 -
58
-
59
-
60
-
61
-
62
-
63
-
64
-
65
-
66
-
67
-
68
-
69
-
70
-
71
-
72
-
73
-
74
-
75
-
76
-
77
-
78
-
79
-
80
-
81
-
82
-
83
-
84
-
85
-
86
-
87
-
88
-
89
-
90
-
91
-
92
-
93
-
94
-
95
-
96
-
97
-
98
-
99
-
100
-
101
-
102
-
103
-
104
-
105
-
106
-
107
-
108
-
109
-
110
-
111
-
112
-
113
-
114
-
115
-
116
-
117
-
118
-
119
-
120
-
121
-
122
-
123
-
124
-
125
-
126
-
127
-
128
-
129
-
130
-
131
-
132
-
133
-
134
-
135
-
136
-
137
-
138
-
139
-
140
-
141
-
142
-
143
-
144
-
145
-
146
-
147
-
148
-
149
-
150
-
151
-
152
-
153
-
154
-
155
-
156
-
157
-
158
-
159
-
160
-
161
-
162
-
163
-
164
-
165
-
166
-
167
-
168
-
169
-
170
-
171
-
172
-
173
-
174
-
175
-
176
-
177
-
178
-
179
-
180
-
181
-
182
-
183
-
184
-
185
-
186
-
187
-
188
-
189
-
190
-
191
-
192
-
193
-
194
-
195
-
196
-
197
-
198
-
199
-
200
-
201
-
202
-
203
-
204
-
205
 |
 |
46
operations (euro 1,809 million) and receivables from
financial operations (euro 3,236 million) less the
financial liabilities of industrial operations. Excluding
interest and currency derivatives, the latter amounted
to euro 1,540 million.
Net assets position
Change in presentation of the Group balance
sheet
For the purposes of preparing its Group financial
statements, the BMW Group has applied revised
IAS 1 (Presentation of Financial Statements),
amended as part of the Improvement Project, at
1 January 2005. This Standard requires the bal-
ance sheet to be classified on the basis of the
maturity of assets and liabilities (current/non-cur-
rent distinction) and, as already reported in quar-
terly reports during 2005, has resulted in a change
in presentation of the Group balance sheet (see
also Note [8] (a)).
The balance sheet total went up by euro 6,932
million or 10.2% to euro 74,566 million. The main
factors behind the increase on the assets side
were the higher level of leased products (+51.6%),
intangible assets (+22.2%) and receivables from
sales financing (+16.0%). On the equity and liabili-
ties side of the balance sheet, the main increases
related to other liabilities (+26.4%), pension provi-
sions (+24.4%) and financial liabilities (+12.1%).
Currency factors, mainly in connection with the higher
exchange rate of the US dollar against the euro,
in-
creased the balance sheet total by euro 3,526 million.
Excluding the effect of exchange rate fluctuations,
the increase would have been 4.8%.
Intangible assets increased by 22.2% to euro
4,593 million. Within intangible assets, capitalised
development costs went up by 18.6% to euro 4,146
million. Development costs recognised as assets
during the year under report amounted to euro 1,396
million (+24.5%), equivalent to a capitalisation ratio
of 44.8% (2004: 39.8%).The increase in capitalised
development costs resulted from the higher volume
of series development projects carried out in 2005.
Amortisation in intangible assets amounted to euro
745 million (+17.0%).
The carrying amount of property, plant and
equipment increased by 3.4% to euro 11,087 mil-
lion.
The bulk of capital expenditure related to further
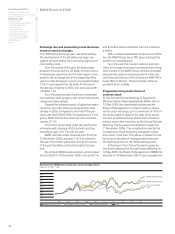
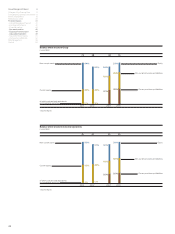
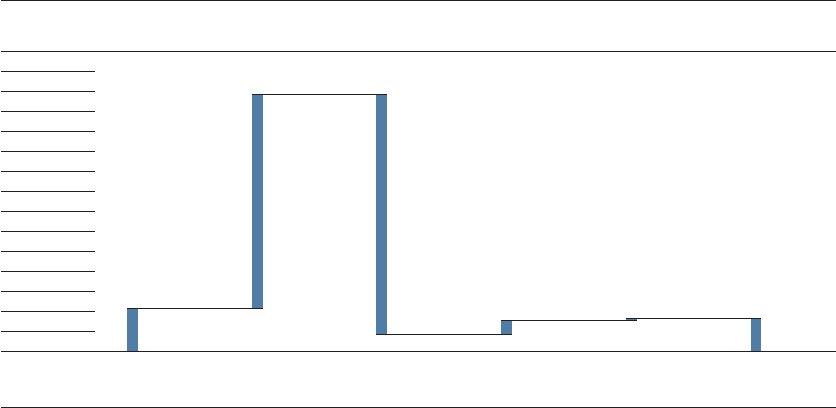
Change in cash and cash equivalents
in euro million
14,000
13,000
12,000
11,000
10,000
9,000
8,000
7,000
6,000
5,000
4,000
3,000
2,000
1,000
Cash and cash
equivalents
31.12. 2004
Cash inflow from
operating activities
Cash outflow from
investing activities
Cash inflow from
financing activities
Currency trans-
lation, changes in
group composition
Cash and cash
equivalents
31.12. 2005
2,128
+ 10,691 – 11,963
+ 699 +66 1,621
Group Management Report 8
A Review of the Financial Year 8
The General Economic Environment 11
Review of operations 15
BMW Stock in 2005 38
Financial Analysis 41
--Internal Management System 41
--Earnings performance 42
--Financial position 45
--Net assets position 46
--Subsequent events report 49
--Value added statement 49
--Key performance figures 51
--Comments on BMW AG 52
Risk Management 56
Outlook 60