BMW 2005 Annual Report Download - page 49
Download and view the complete annual report
Please find page 49 of the 2005 BMW annual report below. You can navigate through the pages in the report by either clicking on the pages listed below, or by using the keyword search tool below to find specific information within the annual report.-
 1
1 -
2
-
3
-
4
-
5
-
6
-
7
-
8
-
9
-
10
-
11
-
12
-
13
-
14
-
15
-
16
-
17
-
18
-
19
-
20
-
21
-
22
-
23
-
24
-
25
-
26
-
27
-
28
-
29
-
30
-
31
-
32
-
33
-
34
-
35
-
36
-
37
-
38
-
 39
39 -
 40
40 -
 41
41 -
 42
42 -
 43
43 -
 44
44 -
 45
45 -
 46
46 -
 47
47 -
 48
48 -
 49
49 -
 50
50 -
 51
51 -
 52
52 -
 53
53 -
 54
54 -
 55
55 -
 56
56 -
 57
57 -
 58
58 -
 59
59 -
60
-
61
-
62
-
63
-
64
-
65
-
66
-
67
-
68
-
69
-
70
-
71
-
72
-
73
-
74
-
75
-
76
-
77
-
78
-
79
-
80
-
81
-
82
-
83
-
84
-
85
-
86
-
87
-
88
-
89
-
90
-
91
-
92
-
93
-
94
-
95
-
96
-
97
-
98
-
99
-
100
-
101
-
102
-
103
-
104
-
105
-
106
-
107
-
108
-
109
-
110
-
111
-
112
-
113
-
114
-
115
-
116
-
117
-
118
-
119
-
120
-
121
-
122
-
123
-
124
-
125
-
126
-
127
-
128
-
129
-
130
-
131
-
132
-
133
-
134
-
135
-
136
-
137
-
138
-
139
-
140
-
141
-
142
-
143
-
144
-
145
-
146
-
147
-
148
-
149
-
150
-
151
-
152
-
153
-
154
-
155
-
156
-
157
-
158
-
159
-
160
-
161
-
162
-
163
-
164
-
165
-
166
-
167
-
168
-
169
-
170
-
171
-
172
-
173
-
174
-
175
-
176
-
177
-
178
-
179
-
180
-
181
-
182
-
183
-
184
-
185
-
186
-
187
-
188
-
189
-
190
-
191
-
192
-
193
-
194
-
195
-
196
-
197
-
198
-
199
-
200
-
201
-
202
-
203
-
204
-
205
 |
 |

48
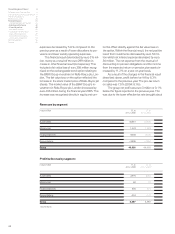
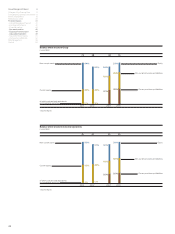
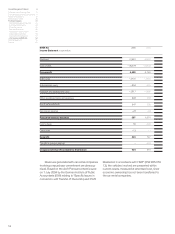
Balance sheet structure Group
in euro billion
75 68 68 75
64 %
36 %
2%
2005
23 %
39 %
38 %
2005
of which cash and cash equivalents
and marketable securities
Current assets
Non-current assets
Current provisions and liabilities
Non-current provisions and liabilities
Equity
Group Management Report 8
A Review of the Financial Year 8
The General Economic Environment 11
Review of operations 15
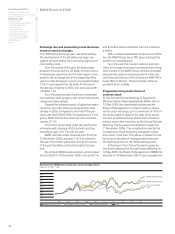
BMW Stock in 2005 38
Financial Analysis 41
--Internal Management System 41
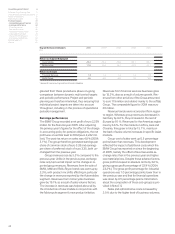
--Earnings performance 42
--Financial position 45
--Net assets position 46
--Subsequent events report 49
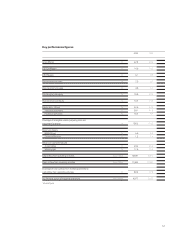
--Value added statement 49
--Key performance figures 51
--Comments on BMW AG 52
Risk Management 56
Outlook 60
Balance sheet structure industrial operations
in euro billion
35 33 33 35
55 %
45 %
4%
2005
39 %
35 %
26 %
2005
of which cash and cash equivalents
and marketable securities
Current assets
Non-current assets
Current provisions and liabilities
Non-current provisions and liabilities
Equity
60 %
40 %
3%
2004*
24 %
39 %
37 %
2004*
*adjusted figures
*adjusted figures
51 %
49 %
6%
2004*
42 %
33 %
25 %
2004*