BMW 2005 Annual Report Download - page 65
Download and view the complete annual report
Please find page 65 of the 2005 BMW annual report below. You can navigate through the pages in the report by either clicking on the pages listed below, or by using the keyword search tool below to find specific information within the annual report.-
 1
1 -
2
-
3
-
4
-
5
-
6
-
7
-
8
-
9
-
10
-
11
-
12
-
13
-
14
-
15
-
16
-
17
-
18
-
19
-
20
-
21
-
22
-
23
-
24
-
25
-
26
-
27
-
28
-
29
-
30
-
31
-
32
-
33
-
34
-
35
-
36
-
37
-
38
-
39
-
40
-
41
-
42
-
43
-
44
-
45
-
46
-
47
-
48
-
49
-
50
-
51
-
52
-
53
-
54
-
 55
55 -
 56
56 -
 57
57 -
 58
58 -
 59
59 -
 60
60 -
 61
61 -
 62
62 -
 63
63 -
 64
64 -
 65
65 -
 66
66 -
 67
67 -
 68
68 -
 69
69 -
 70
70 -
 71
71 -
 72
72 -
 73
73 -
 74
74 -
 75
75 -
76
-
77
-
78
-
79
-
80
-
81
-
82
-
83
-
84
-
85
-
86
-
87
-
88
-
89
-
90
-
91
-
92
-
93
-
94
-
95
-
96
-
97
-
98
-
99
-
100
-
101
-
102
-
103
-
104
-
105
-
106
-
107
-
108
-
109
-
110
-
111
-
112
-
113
-
114
-
115
-
116
-
117
-
118
-
119
-
120
-
121
-
122
-
123
-
124
-
125
-
126
-
127
-
128
-
129
-
130
-
131
-
132
-
133
-
134
-
135
-
136
-
137
-
138
-
139
-
140
-
141
-
142
-
143
-
144
-
145
-
146
-
147
-
148
-
149
-
150
-
151
-
152
-
153
-
154
-
155
-
156
-
157
-
158
-
159
-
160
-
161
-
162
-
163
-
164
-
165
-
166
-
167
-
168
-
169
-
170
-
171
-
172
-
173
-
174
-
175
-
176
-
177
-
178
-
179
-
180
-
181
-
182
-
183
-
184
-
185
-
186
-
187
-
188
-
189
-
190
-
191
-
192
-
193
-
194
-
195
-
196
-
197
-
198
-
199
-
200
-
201
-
202
-
203
-
204
-
205
 |
 |

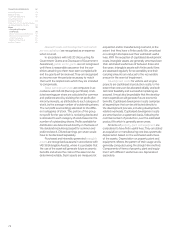
64
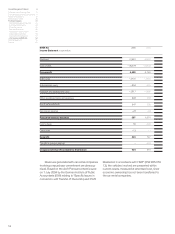
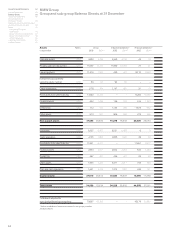
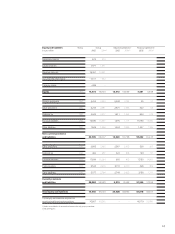
BMW Group
Group and sub-group Balance Sheets at 31 December
Assets Notes Group Industrial operations1] Financial operations1]
in euro million 2005 20042] 2005 20042] 2005 20042]
1] before consolidation of transactions between the sub-groups; unaudited
2] adjusted figures
Intangible assets [20]4,593 3,758 4,569 3,739 24 19
Property, plant and equipment [21]11,087 10,724 11,060 10,703 27 21
Leased products [22]11,375 7,502 230 221 14,110 9,450
Investments accounted for
using the equity method [23]94 65 94 65 ––
Other investments [23]1,178 704 1,147 685 31 19
Receivables from sales financing [24]17,202 15,737 ––17,202 15,737
Financial assets [25]642 1,236 126 193 516 1,043
Deferred tax [26]772 515 1,144 390 –1,674 –992
Other assets [27]613 581 908 849 273 366
Non-current assets 47,556 40,822 19,278 16,845 30,509 25,663
Inventories [28]6,527 6,467 6,521 6,458 69
Trade receivables [29]2,135 1,868 2,086 1,820 49 48
Receivables from sales financing [24]11,851 9,317 ––11,851 9,317
Financial assets [25]2,654 4,517 2,022 3,254 632 1,263
Current tax [26]267 291 238 261 29 30
Other assets [27]1,955 2,224 3,411 2,217 753 800
Cash and cash equivalents [30]1,621 2,128 1,372 1,997 249 131
Current assets 27,010 26,812 15,650 16,007 13,569 11,598
Total assets 74,566 67,634 34,928 32,852 44,078 37,261
Total assets adjusted for
asset backed financing transactions 70,667 63,365 ––40,179 32,992
Group Financial Statements 62
Income Statements 63
Balance Sheets 64
Cash Flow Statements 66
Group Statement of
Changes in Equity 68
Statement of Income and Expenses
recognised directly in Equity 69
Notes 70
--Accounting Principles
and Policies 70
--Notes to the Income Statement 81
--Notes to the balance sheet 90
--Other Disclosures 114
--Segment Information 121
Auditors’ Report 125