BMW 2005 Annual Report Download - page 52
Download and view the complete annual report
Please find page 52 of the 2005 BMW annual report below. You can navigate through the pages in the report by either clicking on the pages listed below, or by using the keyword search tool below to find specific information within the annual report.-
 1
1 -
2
-
3
-
4
-
5
-
6
-
7
-
8
-
9
-
10
-
11
-
12
-
13
-
14
-
15
-
16
-
17
-
18
-
19
-
20
-
21
-
22
-
23
-
24
-
25
-
26
-
27
-
28
-
29
-
30
-
31
-
32
-
33
-
34
-
35
-
36
-
37
-
38
-
39
-
40
-
41
-
 42
42 -
 43
43 -
 44
44 -
 45
45 -
 46
46 -
 47
47 -
 48
48 -
 49
49 -
 50
50 -
 51
51 -
 52
52 -
 53
53 -
 54
54 -
 55
55 -
 56
56 -
 57
57 -
 58
58 -
 59
59 -
 60
60 -
 61
61 -
 62
62 -
63
-
64
-
65
-
66
-
67
-
68
-
69
-
70
-
71
-
72
-
73
-
74
-
75
-
76
-
77
-
78
-
79
-
80
-
81
-
82
-
83
-
84
-
85
-
86
-
87
-
88
-
89
-
90
-
91
-
92
-
93
-
94
-
95
-
96
-
97
-
98
-
99
-
100
-
101
-
102
-
103
-
104
-
105
-
106
-
107
-
108
-
109
-
110
-
111
-
112
-
113
-
114
-
115
-
116
-
117
-
118
-
119
-
120
-
121
-
122
-
123
-
124
-
125
-
126
-
127
-
128
-
129
-
130
-
131
-
132
-
133
-
134
-
135
-
136
-
137
-
138
-
139
-
140
-
141
-
142
-
143
-
144
-
145
-
146
-
147
-
148
-
149
-
150
-
151
-
152
-
153
-
154
-
155
-
156
-
157
-
158
-
159
-
160
-
161
-
162
-
163
-
164
-
165
-
166
-
167
-
168
-
169
-
170
-
171
-
172
-
173
-
174
-
175
-
176
-
177
-
178
-
179
-
180
-
181
-
182
-
183
-
184
-
185
-
186
-
187
-
188
-
189
-
190
-
191
-
192
-
193
-
194
-
195
-
196
-
197
-
198
-
199
-
200
-
201
-
202
-
203
-
204
-
205
 |
 |

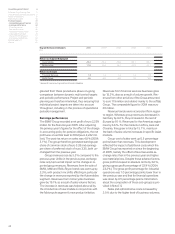
51
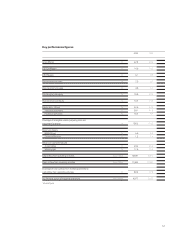
2005 2004*
Gross Margin %22.9 23.2
EBITDA Margin %14.6 14.5
EBIT Margin %8.1 8.5
Pre-tax return on sales %7.0 8.1
Post-tax return on sales %4.8 5.1
Pre-tax return on equity %19.9 23.3
Post-tax return on equity %13.5 14.6
Equity ratio – Group %22.8 24.4
Industrial operations %39.1 41.6
Financial operations %10.4 9.7
Coverage of intangible assets, property, plant and
equipment by equity %108.2 114.2
Return on Assets
BMW Group %5.6 6.5
Financial Services %1.3 1.4
Return on Capital Employed
Automobiles %23.2 25.4
Motorcycles %17.8 10.4
Cash inflow from operating activities euro million 10,691 9,311
Cash outflow from investing activities euro million 11,963 11,957
Coverage of cash outflow from investing activities by
cash inflow from operating activities %89.4 77.9
Net financial assets of industrial operations euro million 4,877 2,632
Key performance figures
*adjusted figures