Avon 2014 Annual Report Download - page 90
Download and view the complete annual report
Please find page 90 of the 2014 Avon annual report below. You can navigate through the pages in the report by either clicking on the pages listed below, or by using the keyword search tool below to find specific information within the annual report.-
 1
1 -
2
-
3
-
4
-
5
-
6
-
7
-
8
-
9
-
10
-
11
-
12
-
13
-
14
-
15
-
16
-
17
-
18
-
19
-
20
-
21
-
22
-
23
-
24
-
25
-
26
-
27
-
28
-
29
-
30
-
31
-
32
-
33
-
34
-
35
-
36
-
37
-
38
-
39
-
40
-
41
-
42
-
43
-
44
-
45
-
46
-
47
-
48
-
49
-
50
-
51
-
52
-
53
-
54
-
55
-
56
-
57
-
58
-
59
-
60
-
61
-
62
-
63
-
64
-
65
-
66
-
67
-
68
-
69
-
70
-
71
-
72
-
73
-
74
-
75
-
76
-
77
-
78
-
79
-
 80
80 -
 81
81 -
 82
82 -
 83
83 -
 84
84 -
 85
85 -
 86
86 -
 87
87 -
 88
88 -
 89
89 -
 90
90 -
 91
91 -
 92
92 -
 93
93 -
 94
94 -
 95
95 -
 96
96 -
 97
97 -
 98
98 -
 99
99 -
 100
100 -
101
-
102
-
103
-
104
-
105
-
106
-
107
-
108
-
109
-
110
-
111
-
112
-
113
-
114
-
115
-
116
-
117
-
118
-
119
-
120
-
121
-
122
-
123
-
124
-
125
-
126
-
127
-
128
-
129
-
130
 |
 |

NOTES TO CONSOLIDATED FINANCIAL STATEMENTS
2012 Silpada Impairment Assessment
In the fourth quarter of 2012, we completed the annual goodwill and indefinite-lived intangible assets impairment assessments and
subsequently determined that the goodwill, indefinite-lived trademark and finite-lived customer relationships associated with Silpada were
impaired. As a result, the carrying amount of Silpada’s goodwill was reduced from $116.7 to its estimated fair value of $44.6, resulting in a
non-cash impairment charge of $72.1. In addition, the carrying amount of Silpada’s indefinite-lived trademark was reduced from $85.0 to its
estimated fair value of $40.0, resulting in a non-cash impairment charge of $45.0, and the carrying amount of Silpada’s finite-lived customer
relationships was reduced from $131.9 to its estimated fair value of $40.0, resulting in a non-cash impairment charge of $91.9.
Throughout the first nine months of 2012, Silpada continued to perform generally in line with our revenue and earnings forecast and there
were no significant changes to our long-term outlook for the business. Our revenue and earnings forecast for 2012 had projected
improvements to the trends (i.e., a reduction of the year-over-year revenue declines) in the latter portion of 2012. In 2012, in an effort to
promote sales and grow the business, we made changes to certain members of the Silpada management team, including bringing in
personnel who had previously managed other Avon businesses. Among the initiatives implemented by the new Silpada management team
was a recruiting incentive program which we had believed would benefit our Representative counts and Representative productivity primarily
in the latter portion of 2012, and in turn improve the performance of the business. While we saw improvement in our Representative
additions, the recruiting incentive program did not result in the expected Representative productivity.
In the fourth quarter of 2012, which was generally the quarter with the largest dollar value of revenue for the Silpada business, it became
apparent that we would not achieve our forecasted revenue and earnings for 2012, partially due to the recruiting incentive program not
driving the expected Representative productivity, and as a result, Silpada experienced weaker than expected performance in the fourth
quarter of 2012. Based on these continued trends, in the latter part of the fourth quarter of 2012, in conjunction with the 2013 planning
process and the early stages of our evaluation of strategic alternatives for the business, we lowered our long-term revenue and earnings
projections for Silpada in our DCF model to reflect a more moderate recovery of the business. The more moderate recovery of the business
was believed to be appropriate due to the lack of sales momentum in the business and the continued inability of Silpada to achieve our
financial performance expectations.
The decline in the fair values of the Silpada reporting unit, the trademark and the customer relationships was primarily driven by the
reduction in the forecasted long-term growth rates and cash flows used to estimate fair value. The lower than expected financial results for
fiscal year 2012 served as the baseline for the long-term projections of the business. Fiscal year 2012 revenue for Silpada was approximately
19% less than fiscal year 2011 results. We forecasted revenue and the resulting cash flows over ten years using a DCF model which included
a terminal value at the end of the projection period.
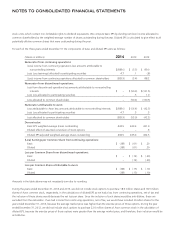
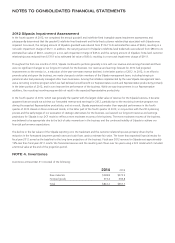
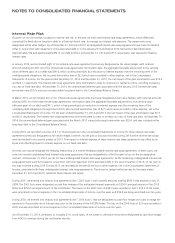
NOTE 4. Inventories
Inventories at December 31 consisted of the following:
2014 2013
Raw materials $248.8 $272.9
Finished goods 573.4 694.8
Total $822.2 $967.7