Avon 2014 Annual Report Download - page 58
Download and view the complete annual report
Please find page 58 of the 2014 Avon annual report below. You can navigate through the pages in the report by either clicking on the pages listed below, or by using the keyword search tool below to find specific information within the annual report.-
 1
1 -
2
-
3
-
4
-
5
-
6
-
7
-
8
-
9
-
10
-
11
-
12
-
13
-
14
-
15
-
16
-
17
-
18
-
19
-
20
-
21
-
22
-
23
-
24
-
25
-
26
-
27
-
28
-
29
-
30
-
31
-
32
-
33
-
34
-
35
-
36
-
37
-
38
-
39
-
40
-
41
-
42
-
43
-
44
-
45
-
46
-
47
-
 48
48 -
 49
49 -
 50
50 -
 51
51 -
 52
52 -
 53
53 -
 54
54 -
 55
55 -
 56
56 -
 57
57 -
 58
58 -
 59
59 -
 60
60 -
 61
61 -
 62
62 -
 63
63 -
 64
64 -
 65
65 -
 66
66 -
 67
67 -
 68
68 -
69
-
70
-
71
-
72
-
73
-
74
-
75
-
76
-
77
-
78
-
79
-
80
-
81
-
82
-
83
-
84
-
85
-
86
-
87
-
88
-
89
-
90
-
91
-
92
-
93
-
94
-
95
-
96
-
97
-
98
-
99
-
100
-
101
-
102
-
103
-
104
-
105
-
106
-
107
-
108
-
109
-
110
-
111
-
112
-
113
-
114
-
115
-
116
-
117
-
118
-
119
-
120
-
121
-
122
-
123
-
124
-
125
-
126
-
127
-
128
-
129
-
130
 |
 |

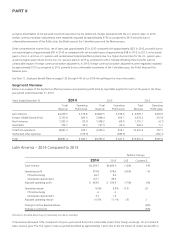
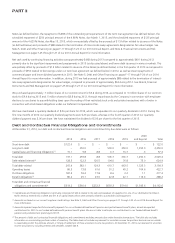
PART II
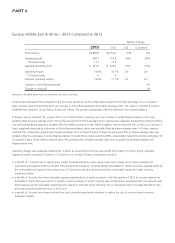
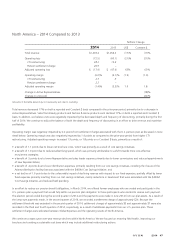
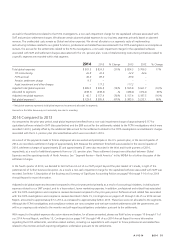
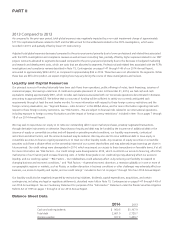
Asia Pacific – 2013 Compared to 2012
%/Point Change
2013 2012 US$ Constant $
Total revenue $757.9 $902.4 (16)% (15)%
Operating (loss) profit (12.1) 5.1 * *
CTI restructuring 5.0 18.2
Asset impairment and other charges 42.1 44.0
Adjusted operating profit $ 35.0 $ 67.3 (48)% (46)%
Operating margin (1.6)% .6% (2.2) (1.8)
CTI restructuring .7 2.0
Asset impairment and other charges 5.6 4.9
Adjusted operating margin 4.6% 7.5% (2.9) (2.7)
Change in Active Representatives(1) (12)%
Change in units sold (16)%
(1) Excludes China.
* Calculation not meaningful
Amounts in the table above may not necessarily sum due to rounding.
Total revenue declined 16% compared to the prior-year period, or 15% on a Constant $ basis, driven by the unfavorable results of our
China operations and a decrease in Active Representatives in the other Asia Pacific markets. The region’s revenue was also negatively
impacted by approximately 1 point as a result of our decision to exit the South Korea and Vietnam markets. Revenue in the Philippines
declined 5%, or 4% on a Constant $ basis, as operational challenges in that market contributed to the decrease in Active Representatives
and a decline in unit sales. Revenue in China declined 42%, or 44% on a Constant $ basis, primarily due to declines in unit sales. We have
experienced operational challenges in China and the number of beauty boutiques has declined. Additionally, we began our transition to a
retail incentive model during the third quarter of 2012, which negatively impacted the region’s Constant $ revenue during the first half of
2013. During the second half of 2013, we also took actions intended to reduce inventory levels held by the beauty boutiques, which
negatively impacted our sales to the beauty boutiques in China.
Operating margin was negatively impacted by .7 points as compared to the prior-year period due to a larger impact from non-cash goodwill
and intangible asset impairment charges associated with our China business during 2013. The non-cash goodwill and intangible asset
impairment charge in the third quarter of 2013 was recorded based on an interim impairment analysis, which was completed as a result of
the significant lowering of our long-term revenue and earnings projections for China and the decline in revenue performance in China in the
third quarter of 2013, which was significantly in excess of our expectations. See Note 16, Goodwill and Intangible Assets on pages F-49
through F-51 of our 2014 Annual Report for more information on China. Operating margin benefited by 1.3 points as compared to the
prior-year period from lower CTI restructuring. Adjusted operating margin decreased 2.9 points, or 2.7 points on a Constant $ basis,
primarily as a result of:
• a decline of 1.5 points due to lower gross margin caused primarily by 1.0 point of unfavorable supply chain costs, primarily driven by
higher material costs and the impact of lower unit volume that was partially offset by productivity initiatives. Gross margin was also
negatively impacted by the net impact of mix and pricing by approximately .9 points partially driven by the underperformance of skincare;
• a decline of .6 points due to an adjustment associated with prior periods related to bad debt expense in the Philippines; and
• the unfavorable impact of lower revenue on fixed costs was significantly offset by benefits from our cost savings initiatives, mainly
reductions in headcount associated with the $400M Cost Savings Initiative, resulting in a net negative impact on Adjusted operating
margin of approximately 1.0 point.
Global and Other Expenses
Global and other expenses include, among other things, costs related to our executive and administrative offices, information technology,
research and development, marketing, professional and related fees associated with the FCPA investigations and compliance reviews, the