Avon 2014 Annual Report Download - page 52
Download and view the complete annual report
Please find page 52 of the 2014 Avon annual report below. You can navigate through the pages in the report by either clicking on the pages listed below, or by using the keyword search tool below to find specific information within the annual report.-
 1
1 -
2
-
3
-
4
-
5
-
6
-
7
-
8
-
9
-
10
-
11
-
12
-
13
-
14
-
15
-
16
-
17
-
18
-
19
-
20
-
21
-
22
-
23
-
24
-
25
-
26
-
27
-
28
-
29
-
30
-
31
-
32
-
33
-
34
-
35
-
36
-
37
-
38
-
39
-
40
-
41
-
 42
42 -
 43
43 -
 44
44 -
 45
45 -
 46
46 -
 47
47 -
 48
48 -
 49
49 -
 50
50 -
 51
51 -
 52
52 -
 53
53 -
 54
54 -
 55
55 -
 56
56 -
 57
57 -
 58
58 -
 59
59 -
 60
60 -
 61
61 -
 62
62 -
63
-
64
-
65
-
66
-
67
-
68
-
69
-
70
-
71
-
72
-
73
-
74
-
75
-
76
-
77
-
78
-
79
-
80
-
81
-
82
-
83
-
84
-
85
-
86
-
87
-
88
-
89
-
90
-
91
-
92
-
93
-
94
-
95
-
96
-
97
-
98
-
99
-
100
-
101
-
102
-
103
-
104
-
105
-
106
-
107
-
108
-
109
-
110
-
111
-
112
-
113
-
114
-
115
-
116
-
117
-
118
-
119
-
120
-
121
-
122
-
123
-
124
-
125
-
126
-
127
-
128
-
129
-
130
 |
 |

PART II
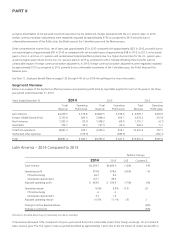
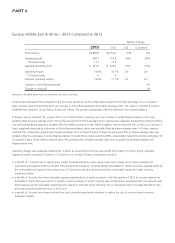
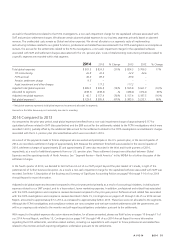
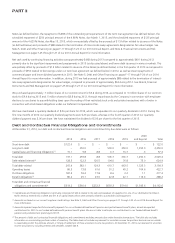
Latin America – 2013 Compared to 2012
%/Point Change
2013 2012 US$ Constant $
Total revenue $4,840.5 $4,993.7 (3)% 6%
Operating profit 478.6 443.9 8% 31%
CTI restructuring 8.4 19.6
Venezuelan special items 49.6 –
Adjusted operating profit $ 536.6 $ 463.5 16% 28%
Operating margin 9.9% 8.9% 1.0 2.1
CTI restructuring .2 .1
Venezuelan special items 1.0 –
Adjusted operating margin 11.1% 9.3% 1.8 2.0
Change in Active Representatives –%
Change in units sold (3)%
Amounts in the table above may not necessarily sum due to rounding.
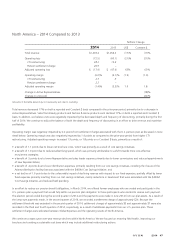
Total revenue decreased 3% compared to the prior-year period due to the unfavorable impact from foreign exchange, including the impact
of the Venezuelan currency devaluation. On a Constant $ basis, revenue grew 6%. The region’s revenue was favorably impacted by
approximately 1 point as a result of the aggregate of the tax credits of approximately $22 recognized in the third quarter of 2013 associated
with a change in estimate of expected recoveries of VAT, as well as the initial realization of a government incentive that was recognized in
the first quarter of 2013 associated with activity in prior years. As the tax credits are associated with VAT, and the government incentive is
associated with excise taxes, which are both recorded as a reduction to revenue, the benefit from these VAT credits and government
incentive is recognized as revenue. The region’s Constant $ revenue growth was primarily due to higher average order, which benefited
from pricing, including inflationary impacts, primarily in Argentina and Venezuela, and new Beauty product launches. Active Representatives
were relatively unchanged. Revenue in Venezuela, Brazil and Mexico declined 17%, 1% and 1%, respectively. Revenue growth in Brazil and
Venezuela was unfavorably impacted by foreign exchange. Constant $ revenue increased 9% in Brazil, and 16% in Venezuela, and declined
4% in Mexico.
Constant $ revenue in Brazil was favorably impacted by approximately 2 points due to the benefit of the aggregate of the VAT credits
recognized in the third quarter of 2013 and the government incentive recognized in the first quarter of 2013. Brazil’s Constant $ revenue
growth was primarily driven by higher average order, as well as an increase in Active Representatives. Higher average order was primarily
due to benefits from pricing, new Beauty product launches and continued strength in Fashion & Home. On a Constant $ basis, Brazil’s sales
from Beauty products increased 3% and sales from Fashion & Home products increased 20% primarily due to more effective pricing and
merchandising.
Constant $ revenue in Mexico was negatively impacted by lower average order, while Active Representatives were relatively unchanged. In
the second half of 2013, Constant $ revenue in Mexico was negatively impacted by executional challenges coupled with the weaker
economy. Constant $ revenue growth in Venezuela was due to higher average order, benefiting from the inflationary impact on pricing that
was partially offset by a decrease in units sold. Higher average order in Venezuela was partially offset by a decrease in Active
Representatives, which was impacted by continued economic and political instability as well as service issues. Revenue and operating profit
in Venezuela was negatively impacted in 2013 by the Venezuelan currency devaluation. Additional information on our Venezuela operations
is discussed in more detail above.
Operating margin was negatively impacted by 1.0 point due to the Venezuelan currency devaluation in conjunction with highly inflationary
accounting as discussed further above. Operating margin benefited by .2 points as compared to the prior-year period from lower CTI
restructuring. Adjusted operating margin increased 1.8 points, or 2.0 points on a Constant $ basis, primarily as a result of:
• a benefit of .5 points associated with the aggregate of the VAT credits in Brazil recognized in the third quarter of 2013 and the
government incentive in Brazil recognized in the first quarter of 2013, discussed above;