Avon 2014 Annual Report Download - page 37
Download and view the complete annual report
Please find page 37 of the 2014 Avon annual report below. You can navigate through the pages in the report by either clicking on the pages listed below, or by using the keyword search tool below to find specific information within the annual report.-
 1
1 -
2
-
3
-
4
-
5
-
6
-
7
-
8
-
9
-
10
-
11
-
12
-
13
-
14
-
15
-
16
-
17
-
18
-
19
-
20
-
21
-
22
-
23
-
24
-
25
-
26
-
 27
27 -
 28
28 -
 29
29 -
 30
30 -
 31
31 -
 32
32 -
 33
33 -
 34
34 -
 35
35 -
 36
36 -
 37
37 -
 38
38 -
 39
39 -
 40
40 -
 41
41 -
 42
42 -
 43
43 -
 44
44 -
 45
45 -
 46
46 -
 47
47 -
48
-
49
-
50
-
51
-
52
-
53
-
54
-
55
-
56
-
57
-
58
-
59
-
60
-
61
-
62
-
63
-
64
-
65
-
66
-
67
-
68
-
69
-
70
-
71
-
72
-
73
-
74
-
75
-
76
-
77
-
78
-
79
-
80
-
81
-
82
-
83
-
84
-
85
-
86
-
87
-
88
-
89
-
90
-
91
-
92
-
93
-
94
-
95
-
96
-
97
-
98
-
99
-
100
-
101
-
102
-
103
-
104
-
105
-
106
-
107
-
108
-
109
-
110
-
111
-
112
-
113
-
114
-
115
-
116
-
117
-
118
-
119
-
120
-
121
-
122
-
123
-
124
-
125
-
126
-
127
-
128
-
129
-
130
 |
 |

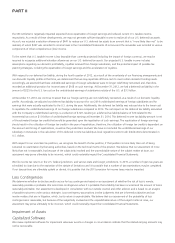
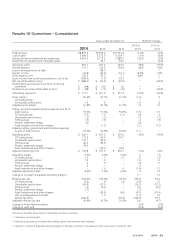
A 50 basis point change (in either direction) in the expected rate of return on plan assets, the discount rate or the rate of compensation
increases, would have had approximately the following effect on 2014 pension expense and the pension benefit obligation at December 31,
2014:
Increase/(Decrease) in
Pension Expense
Increase/(Decrease) in
Pension Obligation
50 Basis Point 50 Basis Point
Increase Decrease Increase Decrease
Rate of return on assets $(5.8) $ 5.8 N/A N/A
Discount rate (9.8) 10.0 $(120.0) $129.9
Rate of compensation increase 1.5 (1.5) 7.2 (7.0)
Restructuring Reserves
We record the estimated expense for our restructuring initiatives when such costs are deemed probable and estimable, when approved by
the appropriate corporate authority and by accumulating detailed estimates of costs for such plans. These expenses include the estimated
costs of employee severance and related benefits, impairment or accelerated depreciation of property, plant and equipment and capitalized
software, and any other qualifying exit costs. These estimated costs are grouped by specific projects within the overall plan and are then
monitored on a quarterly basis by finance personnel. Such costs represent our best estimate, but require assumptions about the programs
that may change over time, including attrition rates. Estimates are evaluated periodically to determine whether an adjustment is required.
Taxes
We record a valuation allowance to reduce our deferred tax assets to an amount that is “more likely than not” to be realized. Evaluating the
need for and quantifying the valuation allowance often requires significant judgment and extensive analysis of all the weighted positive and
negative evidence available to the Company in order to determine whether all or some portion of the deferred tax assets will not be realized.
In performing this analysis, the Company’s forecasted domestic and foreign taxable income, and the existence of potential prudent and
feasible tax planning strategies that would enable the Company to utilize some or all of its excess foreign tax credits, were taken into
consideration.
At December 31, 2014, we had net deferred tax assets of $858 (net of valuation allowances of $1,209).
With respect to our deferred tax assets, at December 31, 2014, we had recognized deferred tax assets relating to tax loss carryforwards of
$726, primarily from foreign jurisdictions, for which a valuation allowance of $718 has been provided. Prior to December 31, 2014, we had
recognized deferred tax assets of $618 relating to excess U.S. foreign tax credit carryforwards of which $57, $44, $54, $124, $79, $225 and
$35 expire at the end of 2018, 2019, 2020, 2021, 2022, 2023 and 2024, respectively. We have a history of domestic source losses, and our
excess U.S. foreign tax credits have primarily resulted from having a greater domestic source loss in recent years which reduces foreign
source income. During 2013, our domestic source loss included the tax losses generated from the sale of our Silpada business and our losses
on extinguishment of debt, which led to an increase in our excess foreign tax credit carryforwards generated in 2013, which expire in 2023.
Our ability to realize our U.S. deferred tax assets, such as our foreign tax credit carryforwards, is dependent on future U.S. taxable income
within the carryforward period. At December 31, 2014, we would need to generate approximately $1.8 billion of excess net foreign source
income in order to realize the U.S. foreign tax credits before they expire. In the assessment of our deferred tax asset position, we have relied
on tax planning strategies that would, if necessary, be implemented to accelerate sufficient taxable amounts to utilize our excess foreign tax
credits.
During the fourth quarter of 2014, the Company’s expected net foreign source income was reduced significantly, primarily due to the
strengthening of the U.S. dollar against currencies for some of our key markets and, to a lesser extent, the finalization of the FCPA
settlements. This strengthening of the U.S. dollar reduced the expected dividends and royalties that could be remitted to the U.S. by our
foreign subsidiaries, particularly Russia, Brazil, Mexico and Colombia. The effectiveness of our tax planning strategies, including the
repatriation of foreign earnings and the acceleration of royalties from our foreign subsidiaries, was also negatively impacted by the
strengthening of the U.S. dollar. In addition, the finalization of the FCPA settlements, which included a $68 fine related to Avon China in
connection with the DOJ settlement and $67 in disgorgement and prejudgment interest related to Avon Products, Inc. in connection with
A V O N 2014 29