Avon 2014 Annual Report Download - page 60
Download and view the complete annual report
Please find page 60 of the 2014 Avon annual report below. You can navigate through the pages in the report by either clicking on the pages listed below, or by using the keyword search tool below to find specific information within the annual report.-
 1
1 -
2
-
3
-
4
-
5
-
6
-
7
-
8
-
9
-
10
-
11
-
12
-
13
-
14
-
15
-
16
-
17
-
18
-
19
-
20
-
21
-
22
-
23
-
24
-
25
-
26
-
27
-
28
-
29
-
30
-
31
-
32
-
33
-
34
-
35
-
36
-
37
-
38
-
39
-
40
-
41
-
42
-
43
-
44
-
45
-
46
-
47
-
48
-
49
-
 50
50 -
 51
51 -
 52
52 -
 53
53 -
 54
54 -
 55
55 -
 56
56 -
 57
57 -
 58
58 -
 59
59 -
 60
60 -
 61
61 -
 62
62 -
 63
63 -
 64
64 -
 65
65 -
 66
66 -
 67
67 -
 68
68 -
 69
69 -
 70
70 -
71
-
72
-
73
-
74
-
75
-
76
-
77
-
78
-
79
-
80
-
81
-
82
-
83
-
84
-
85
-
86
-
87
-
88
-
89
-
90
-
91
-
92
-
93
-
94
-
95
-
96
-
97
-
98
-
99
-
100
-
101
-
102
-
103
-
104
-
105
-
106
-
107
-
108
-
109
-
110
-
111
-
112
-
113
-
114
-
115
-
116
-
117
-
118
-
119
-
120
-
121
-
122
-
123
-
124
-
125
-
126
-
127
-
128
-
129
-
130
 |
 |

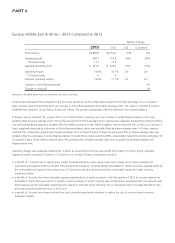
PART II
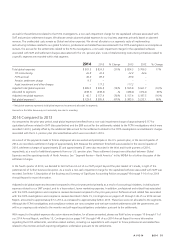
2013 Compared to 2012
As compared to the prior-year period, total global expenses was negatively impacted by a non-cash impairment charge of approximately
$117 for capitalized software related to SMT and the $89 accrual for the settlements related to the FCPA investigations, which were
recorded in 2013, and partially offset by lower CTI restructuring.
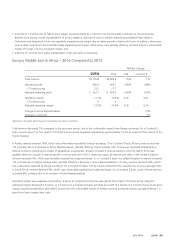
Adjusted total global expenses decreased compared to the prior-year period primarily due to lower professional and related fees associated
with the FCPA investigations and compliance reviews as well as lower consulting fees, partially offset by higher expenses related to our SMT
project. Amounts allocated to segments decreased compared to the prior-year period primarily due to the decrease in budgeted marketing
and research and development costs, which are costs that are allocated to segments. Professional and related fees associated with the FCPA
investigations and compliance reviews described in Note 15, Contingencies on pages F-47 through F-49 of our 2014 Annual Report,
amounted to approximately $28 in 2013, as compared to approximately $92 in 2012. These fees were not allocated to the segments. While
these fees are difficult to predict, we expect ongoing fees may vary during the course of these investigations and reviews.
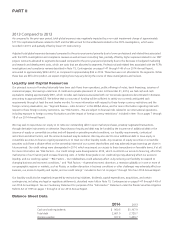
Liquidity and Capital Resources
Our principal sources of funding historically have been cash flows from operations, public offerings of notes, bank financings, issuance of
commercial paper, borrowings under lines of credit and a private placement of notes. At December 31, 2014, we had cash and cash
equivalents totaling approximately $961, which includes cash balances associated with our Venezuela operations denominated in Bolívares
amounting to approximately $3. We believe that our sources of funding will be sufficient to satisfy our currently anticipated cash
requirements through at least the next twelve months. For more information with respect to these foreign currency restrictions and the
foreign currency devaluation, see “Segment Review – Latin America” in this MD&A above, and for more information regarding risks with
respect to these foreign currency restrictions, see “Risk Factors – We are subject to financial risks related to our international operations,
including exposure to foreign currency fluctuations and the impact of foreign currency restrictions” included in Item 1A on pages 7 through
18 of our 2014 Annual Report.
We may seek to repurchase our equity or to retire our outstanding debt in open market purchases, privately negotiated transactions,
through derivative instruments or otherwise. Repurchases of equity and debt may be funded by the incurrence of additional debt or the
issuance of equity or convertible securities and will depend on prevailing market conditions, our liquidity requirements, contractual
restrictions and other factors, and the amounts involved may be material. We may also elect to incur additional debt or issue equity or
convertible securities to finance ongoing operations or to meet our other liquidity needs. Any issuances of equity securities or convertible
securities could have a dilutive effect on the ownership interest of our current shareholders and may adversely impact earnings per share in
future periods. Our credit ratings were downgraded in 2014, which may impact our access to these transactions on favorable terms, if at all.
For more information see “Risk Factors – Our credit ratings were downgraded in 2014, which could limit our access to financing, affect the
market price of our financing and increase financing costs. A further downgrade in our credit ratings may adversely affect our access to
liquidity, and our working capital,” “Risk Factors – Our indebtedness could adversely affect us by reducing our flexibility to respond to
changing business and economic conditions,” and “Risk Factors – A general economic downturn, a recession globally or in one or more of
our geographic regions or markets, such as Russia, or sudden disruption in business conditions or other challenges may adversely affect our
business, our access to liquidity and capital, and our credit ratings” included in Item 1A on pages 7 through 18 of our 2014 Annual Report.
Our liquidity could also be negatively impacted by restructuring initiatives, dividends, capital expenditures, acquisitions, and certain
contingencies, including any legal or regulatory settlements, described more fully in Note 15, Contingencies on pages F-47 through F-49 of
our 2014 Annual Report. See our Cautionary Statement for purposes of the “Safe Harbor” Statement under the Private Securities Litigation
Reform Act of 1995 on pages 1 through 2 of our 2014 Annual Report.
Balance Sheet Data
2014 2013
Cash and cash equivalents $ 960.5 $1,107.9
Total debt 2,601.0 2,720.7
Working capital 917.3 1,200.7