Avon 2014 Annual Report Download - page 48
Download and view the complete annual report
Please find page 48 of the 2014 Avon annual report below. You can navigate through the pages in the report by either clicking on the pages listed below, or by using the keyword search tool below to find specific information within the annual report.-
 1
1 -
2
-
3
-
4
-
5
-
6
-
7
-
8
-
9
-
10
-
11
-
12
-
13
-
14
-
15
-
16
-
17
-
18
-
19
-
20
-
21
-
22
-
23
-
24
-
25
-
26
-
27
-
28
-
29
-
30
-
31
-
32
-
33
-
34
-
35
-
36
-
37
-
 38
38 -
 39
39 -
 40
40 -
 41
41 -
 42
42 -
 43
43 -
 44
44 -
 45
45 -
 46
46 -
 47
47 -
 48
48 -
 49
49 -
 50
50 -
 51
51 -
 52
52 -
 53
53 -
 54
54 -
 55
55 -
 56
56 -
 57
57 -
 58
58 -
59
-
60
-
61
-
62
-
63
-
64
-
65
-
66
-
67
-
68
-
69
-
70
-
71
-
72
-
73
-
74
-
75
-
76
-
77
-
78
-
79
-
80
-
81
-
82
-
83
-
84
-
85
-
86
-
87
-
88
-
89
-
90
-
91
-
92
-
93
-
94
-
95
-
96
-
97
-
98
-
99
-
100
-
101
-
102
-
103
-
104
-
105
-
106
-
107
-
108
-
109
-
110
-
111
-
112
-
113
-
114
-
115
-
116
-
117
-
118
-
119
-
120
-
121
-
122
-
123
-
124
-
125
-
126
-
127
-
128
-
129
-
130
 |
 |

PART II
as higher amortization of net actuarial loss which was driven by the settlement charges associated with the U.S. pension plan. In 2014,
foreign currency translation adjustments were negatively impacted by approximately $136 as compared to 2013 primarily due to
unfavorable movements of the Polish zloty, the British pound, the Colombian peso and the Mexican peso.
Other comprehensive income (loss), net of taxes was approximately $5 in 2013 compared with approximately ($22) in 2012, primarily due to
net actuarial gains of approximately $81 in 2013 as compared with net actuarial losses of approximately $58 in 2012. In 2013, net actuarial
gains in the U.S. and non-U.S. pension and postretirement plans benefited primarily due to a higher discount rate for the U.S. pension plan,
as well as higher asset returns for the non-U.S. pension plans in 2013 as compared to 2012. Partially offsetting these benefits was the
unfavorable impact of foreign currency translation adjustments. In 2013, foreign currency translation adjustments were negatively impacted
by approximately $113 as compared to 2012 primarily due to unfavorable movements of the Colombian peso, the Polish zloty and the
Mexican peso.
See Note 11, Employee Benefit Plans on pages F-32 through F-40 of our 2014 Annual Report for more information.
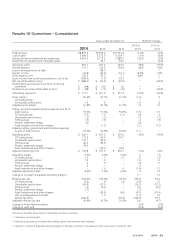
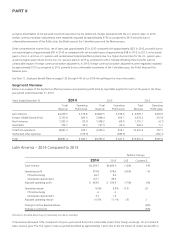
Segment Review
Below is an analysis of the key factors affecting revenue and operating profit (loss) by reportable segment for each of the years in the three-
year period ended December 31, 2014.
Years ended December 31 2014 2013 2012
Total
Revenue
Operating
Profit (Loss)
Total
Revenue
Operating
Profit (Loss)
Total
Revenue
Operating
Profit (Loss)
Latin America $4,239.5 $ 279.8 $4,840.5 $ 478.6 $ 4,993.7 $443.9
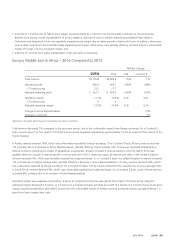
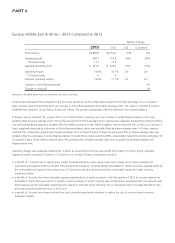
Europe, Middle East & Africa 2,705.8 300.9 2,898.4 406.7 2,914.2 312.8
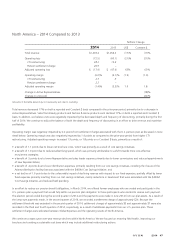
North America 1,203.4 (72.5) 1,458.2 (60.1) 1,751.1 (4.7)
Asia Pacific 702.7 20.9 757.9 (12.1) 902.4 5.1
Total from operations 8,851.4 529.1 9,955.0 813.1 10,561.4 757.1
Global and other expenses – (129.0) – (385.9) – (232.1)
Total $8,851.4 $ 400.1 $9,955.0 $ 427.2 $10,561.4 $525.0
Latin America – 2014 Compared to 2013
%/Point Change
2014 2013 US$ Constant $
Total revenue $4,239.5 $4,840.5 (12)% 5%
Operating profit 279.8 478.6 (42)% –%
CTI restructuring 26.7 8.4
Venezuelan special items 137.1 49.6
Adjusted operating profit $ 443.6 $ 536.6 (17)% 6%
Operating margin 6.6% 9.9% (3.3) (.5)
CTI restructuring .6 .2
Venezuelan special items 3.2 1.0
Adjusted operating margin 10.5% 11.1% (.6) .1
Change in Active Representatives (4)%
Change in units sold (4)%
Amounts in the table above may not necessarily sum due to rounding.
Total revenue decreased 12% compared to the prior-year period due to the unfavorable impact from foreign exchange. On a Constant $
basis, revenue grew 5%. The region’s revenue growth benefited by approximately 1 point due to the net impact of certain tax benefits in