Avon 2014 Annual Report Download - page 45
Download and view the complete annual report
Please find page 45 of the 2014 Avon annual report below. You can navigate through the pages in the report by either clicking on the pages listed below, or by using the keyword search tool below to find specific information within the annual report.-
 1
1 -
2
-
3
-
4
-
5
-
6
-
7
-
8
-
9
-
10
-
11
-
12
-
13
-
14
-
15
-
16
-
17
-
18
-
19
-
20
-
21
-
22
-
23
-
24
-
25
-
26
-
27
-
28
-
29
-
30
-
31
-
32
-
33
-
34
-
 35
35 -
 36
36 -
 37
37 -
 38
38 -
 39
39 -
 40
40 -
 41
41 -
 42
42 -
 43
43 -
 44
44 -
 45
45 -
 46
46 -
 47
47 -
 48
48 -
 49
49 -
 50
50 -
 51
51 -
 52
52 -
 53
53 -
 54
54 -
 55
55 -
56
-
57
-
58
-
59
-
60
-
61
-
62
-
63
-
64
-
65
-
66
-
67
-
68
-
69
-
70
-
71
-
72
-
73
-
74
-
75
-
76
-
77
-
78
-
79
-
80
-
81
-
82
-
83
-
84
-
85
-
86
-
87
-
88
-
89
-
90
-
91
-
92
-
93
-
94
-
95
-
96
-
97
-
98
-
99
-
100
-
101
-
102
-
103
-
104
-
105
-
106
-
107
-
108
-
109
-
110
-
111
-
112
-
113
-
114
-
115
-
116
-
117
-
118
-
119
-
120
-
121
-
122
-
123
-
124
-
125
-
126
-
127
-
128
-
129
-
130
 |
 |

Impact of Foreign Currency
During 2014, foreign currency had a significant impact on our financial results. Specifically, as compared to the prior-year period, foreign
currency has impacted our consolidated financial results as a result of:
• foreign currency transaction losses (within cost of sales, and selling, general and administrative expenses), which had an unfavorable
impact to Adjusted operating profit of an estimated $155, or approximately 150 points to Adjusted operating margin;
• foreign currency translation, which had an unfavorable impact to Adjusted operating profit of approximately $160, or approximately 70
points to Adjusted operating margin; and
• foreign exchange losses (within other expense, net), which had an unfavorable impact of approximately $41 before tax.
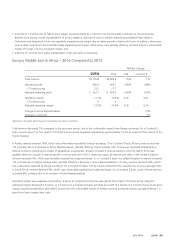
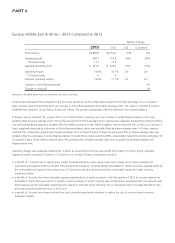
2013 Compared to 2012
Revenue
Total revenue in 2013 compared to 2012 declined 6% compared to the prior-year period, partially due to unfavorable foreign exchange.
Constant $ revenue declined 1%, as a 2% decrease in Active Representatives was partially offset by a 1% increase in average order. Units
sold decreased 5% while the net impact of price and mix increased 4%, as pricing benefited from inflationary impacts in Latin America,
primarily in Argentina and Venezuela.
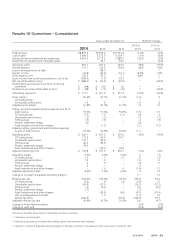
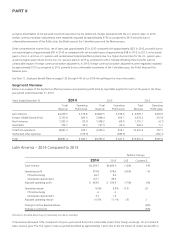
On a category basis, our net sales and associated growth rates were as follows:
Years ended December 31 %/Point Change
2013 2012 US$ Constant $
Beauty:
Skincare $2,924.6 $ 3,238.7 (10)% (8)%
Fragrance 2,380.9 2,487.2 (4) 2
Color 1,797.7 1,916.8 (6) (1)
Total Beauty 7,103.2 7,642.7 (7) (2)
Fashion & Home:
Fashion 1,623.5 1,750.9 (7) (4)
Home 1,037.7 1,011.7 3 9
Total Fashion & Home 2,661.2 2,762.6 (4) 1
Net sales $9,764.4 $10,405.3 (6) (1)
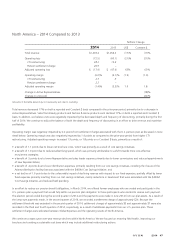
Our Constant $ revenue was impacted by net declines in North America and Asia Pacific; however, these declines were partially offset by
improvements in Latin America and Europe, Middle East & Africa. Growth in Latin America was driven by Brazil, particularly in Fashion &
Home, and Venezuela primarily due to inflationary pricing, which was partially offset by executional challenges in Mexico in the second half
of 2013. In Europe, Middle East & Africa, growth was driven by South Africa, Russia and Turkey, which was partially offset by a revenue
decline in the United Kingdom. North America experienced deteriorating financial results, primarily as a result of the decline in Active
Representatives. Asia Pacific’s revenue decline was primarily due to continuing weak performance of our China operations and operational
challenges in the Philippines. See “Segment Review” in this MD&A for additional information related to changes in revenue by segment.
Operating Margin
Operating margin decreased 70 basis points and Adjusted operating margin increased 130 basis points compared to 2012. The increase in
Adjusted operating margin includes the benefits associated with the $400M Cost Savings Initiative. The decrease in operating margin and
increase in Adjusted operating margin are discussed further below in “Gross Margin,” “Selling, General and Administrative Expenses” and
“Impairment of Goodwill and Intangible Assets.”
Gross Margin
Gross margin and Adjusted gross margin increased by 90 basis points and 130 basis points, respectively, compared to 2012. The gross
margin comparison was largely impacted by the devaluation of the Venezuelan currency in conjunction with highly inflationary accounting,
A V O N 2014 37