Avon 2014 Annual Report Download - page 115
Download and view the complete annual report
Please find page 115 of the 2014 Avon annual report below. You can navigate through the pages in the report by either clicking on the pages listed below, or by using the keyword search tool below to find specific information within the annual report.-
 1
1 -
2
-
3
-
4
-
5
-
6
-
7
-
8
-
9
-
10
-
11
-
12
-
13
-
14
-
15
-
16
-
17
-
18
-
19
-
20
-
21
-
22
-
23
-
24
-
25
-
26
-
27
-
28
-
29
-
30
-
31
-
32
-
33
-
34
-
35
-
36
-
37
-
38
-
39
-
40
-
41
-
42
-
43
-
44
-
45
-
46
-
47
-
48
-
49
-
50
-
51
-
52
-
53
-
54
-
55
-
56
-
57
-
58
-
59
-
60
-
61
-
62
-
63
-
64
-
65
-
66
-
67
-
68
-
69
-
70
-
71
-
72
-
73
-
74
-
75
-
76
-
77
-
78
-
79
-
80
-
81
-
82
-
83
-
84
-
85
-
86
-
87
-
88
-
89
-
90
-
91
-
92
-
93
-
94
-
95
-
96
-
97
-
98
-
99
-
100
-
101
-
102
-
103
-
104
-
 105
105 -
 106
106 -
 107
107 -
 108
108 -
 109
109 -
 110
110 -
 111
111 -
 112
112 -
 113
113 -
 114
114 -
 115
115 -
 116
116 -
 117
117 -
 118
118 -
 119
119 -
 120
120 -
 121
121 -
 122
122 -
 123
123 -
 124
124 -
 125
125 -
126
-
127
-
128
-
129
-
130
 |
 |

NOTE 12. Segment Information
Our reportable segments are based on geographic operations and include commercial business units in Latin America; Europe, Middle East &
Africa; North America; and Asia Pacific. The segments have similar business characteristics and each offers similar products through similar
customer access methods.
Global and other expenses include, among other things, costs related to our executive and administrative offices, information technology,
research and development, marketing, professional and related fees associated with the FCPA investigations and compliance reviews, the
accrual for the settlements related to the FCPA investigations, a non-cash impairment charge for the capitalized software associated with
SMT and pension settlement charges. We allocate certain planned global expenses to our business segments primarily based on planned
revenue. The unallocated costs remain as Global and other expenses. We do not allocate to our segments costs of implementing
restructuring initiatives related to our global functions, professional and related fees associated with the FCPA investigations and compliance
reviews, the accrual for the settlements related to the FCPA investigations, a non-cash impairment charge for the capitalized software
associated with SMT and settlement charges associated with the U.S. pension plan. Costs of implementing restructuring initiatives related to
a specific segment are recorded within that segment.
The accounting policies of the segments are the same as those described in Note 1, Description of the Business and Summary of Significant
Accounting Policies. We evaluate the performance of our segments based on revenues and operating profits or losses. Segment revenues
primarily reflect direct sales of products to Representatives based on the Representative’s geographic location. Intersegment sales and
transfers are not significant. Each segment records direct expenses related to its employees and its operations.
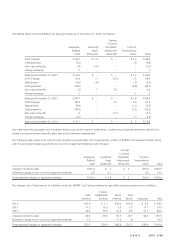
Summarized financial information concerning our reportable segments as of December 31 is shown in the following tables:
Total Revenue & Operating Profit (Loss)
2014 2013 2012
Total
Revenue
Operating
Profit (Loss)
Total
Revenue
Operating
Profit (Loss)
Total
Revenue
Operating
Profit (Loss)
Latin America $ 4,239.5 $ 279.8 $4,840.5 $ 478.6 $ 4,993.7 $ 443.9
Europe, Middle East & Africa 2,705.8 300.9 2,898.4 406.7 2,914.2 312.8
North America 1,203.4 (72.5) 1,458.2 (60.1) 1,751.1 (4.7)
Asia Pacific 702.7 20.9 757.9 (12.1) 902.4 5.1
Total from operations 8,851.4 529.1 9,955.0 813.1 10,561.4 757.1
Global and other – (129.0) – (385.9) – (232.1)
Total $ 8,851.4 $ 400.1 $9,955.0 $ 427.2 $10,561.4 $ 525.0
Total Assets
2014 2013 2012
Latin America $ 2,033.0 $ 2,432.7 $ 2,713.3
Europe, Middle East & Africa 1,170.6 1,370.9 1,380.2
North America 429.9 519.5 635.9
Asia Pacific 390.8 441.7 537.7
Total from continuing operations 4,024.3 4,764.8 5,267.1
Total from discontinued operations – – 190.6
Global and other 1,472.5 1,727.5 1,924.8
Total assets $ 5,496.8 $ 6,492.3 $ 7,382.5
A V O N 2014 F-41