Avon 2014 Annual Report Download - page 47
Download and view the complete annual report
Please find page 47 of the 2014 Avon annual report below. You can navigate through the pages in the report by either clicking on the pages listed below, or by using the keyword search tool below to find specific information within the annual report.-
 1
1 -
2
-
3
-
4
-
5
-
6
-
7
-
8
-
9
-
10
-
11
-
12
-
13
-
14
-
15
-
16
-
17
-
18
-
19
-
20
-
21
-
22
-
23
-
24
-
25
-
26
-
27
-
28
-
29
-
30
-
31
-
32
-
33
-
34
-
35
-
36
-
 37
37 -
 38
38 -
 39
39 -
 40
40 -
 41
41 -
 42
42 -
 43
43 -
 44
44 -
 45
45 -
 46
46 -
 47
47 -
 48
48 -
 49
49 -
 50
50 -
 51
51 -
 52
52 -
 53
53 -
 54
54 -
 55
55 -
 56
56 -
 57
57 -
58
-
59
-
60
-
61
-
62
-
63
-
64
-
65
-
66
-
67
-
68
-
69
-
70
-
71
-
72
-
73
-
74
-
75
-
76
-
77
-
78
-
79
-
80
-
81
-
82
-
83
-
84
-
85
-
86
-
87
-
88
-
89
-
90
-
91
-
92
-
93
-
94
-
95
-
96
-
97
-
98
-
99
-
100
-
101
-
102
-
103
-
104
-
105
-
106
-
107
-
108
-
109
-
110
-
111
-
112
-
113
-
114
-
115
-
116
-
117
-
118
-
119
-
120
-
121
-
122
-
123
-
124
-
125
-
126
-
127
-
128
-
129
-
130
 |
 |
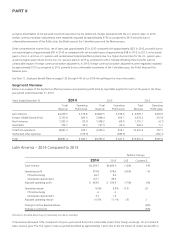
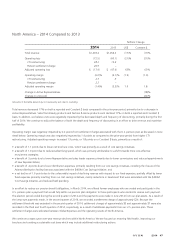
Loss on extinguishment of debt in 2013 is comprised of approximately $71 for the make-whole premium and the write-off of debt issuance
costs associated with the prepayment of our Private Notes (as defined below in “Liquidity and Capital Resources”) and approximately $2 for
the write-off of debt issuance costs associated with the early repayment of $380 of the outstanding principal amount of the term loan
agreement (as defined below in “Liquidity and Capital Resources”), which occurred in the first quarter of 2013. In addition, in the second
quarter of 2013 we recorded a loss on extinguishment of debt of approximately $13 for the make-whole premium and the write-off of debt
issuance costs, partially offset by a deferred gain associated with the January 2013 interest-rate swap agreement termination, associated
with the prepayment of our 2014 Notes (as defined below in “Liquidity and Capital Resources”). See Note 5, Debt and Other Financing on
pages F-17 through F-20 of our 2014 Annual Report, and “Liquidity and Capital Resources” in this MD&A for more information.
Interest income increased by approximately $11 compared to the prior-year period, primarily impacted by the benefit of approximately $12
for interest income recognized in the fourth quarter of 2013, due to an out-of-period adjustment related to judicial deposits in Brazil. This
out-of-period benefit to interest income was partially offset by lower average interest rates, as well as lower average cash balances in 2013
as compared to 2012.
Other expense, net increased by approximately $77 compared to the prior-year period, primarily due to an approximate $34 negative impact
in the first quarter of 2013 from the devaluation of the Venezuelan currency on monetary assets and liabilities in conjunction with highly
inflationary accounting. In addition, other expense, net was impacted by the benefit of approximately $24 in 2012 due to the release of a
provision in the fourth quarter of 2012 associated with the excess cost of acquiring U.S. dollars in Venezuela at the regulated market rate as
compared with the official exchange rate. This provision was released as the Company capitalized the associated intercompany liabilities. See
“Segment Review – Latin America” in this MD&A for a further discussion of Venezuela.
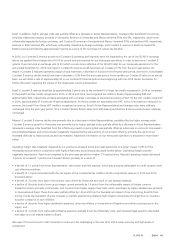
Effective Tax Rate
The effective tax rate for 2013 was 100.6%, compared to 78.2% for 2012.
During the fourth quarter of 2012, as a result of the uncertainty of our financing arrangements and our domestic liquidity profile at that
time, we determined that the Company may repatriate offshore cash to meet certain domestic funding needs. Accordingly, at that time, we
asserted that the undistributed earnings of foreign subsidiaries were no longer indefinitely reinvested, and therefore, we recorded an
additional provision for income taxes of approximately $168 related to the incremental U.S. taxes associated with the unremitted foreign
earnings, which increased the 2012 tax rate. The effective tax rate in 2012 was also unfavorably impacted by the non-cash impairment
charges for goodwill and intangible assets associated with our China business of $44.
At December 31, 2013, we continue to assert that the Company’s foreign earnings may not be indefinitely reinvested, as a result of our
domestic liquidity profile. In this regard, the 2013 effective tax rate was favorably impacted primarily due to the country mix of earnings and
the lower expected tax cost to repatriate the undistributed earnings of our foreign subsidiaries. The 2013 effective tax rate was also
unfavorably impacted by the non-cash impairment charges for goodwill and intangible assets associated with our China business of
approximately $42. The rate was further impacted unfavorably by the devaluation of the Venezuelan currency in conjunction with highly
inflationary accounting discussed further within “Segment Review – Latin America” in this MD&A, and the $89 accrual for the settlements
related to the FCPA investigations. Additionally, the rate was negatively impacted by a valuation allowance for deferred tax assets related to
China in the third quarter of approximately $9 and Venezuela in the fourth quarter of approximately $42. The valuation allowance in
Venezuela was due to the impact of higher than expected inflation on our taxable income which negatively impacted the likelihood we
would realize existing deferred tax assets. Given the short life of the net operating loss carryforward periods for these markets, we
determined that it was more likely than not that we would not use these carryforward losses before they expire.
The Adjusted effective tax rate for 2013 was 30.3%, compared to 35.0% for 2012, primarily due to the country mix of earnings and the
lower expected tax cost to repatriate the undistributed earnings of our foreign subsidiaries.
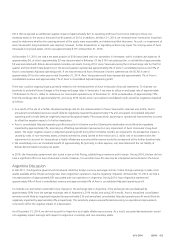
Other Comprehensive Income (Loss)
Other comprehensive income (loss), net of taxes was approximately ($348) in 2014 compared with approximately $5 in 2013, primarily due
to net actuarial losses of approximately $187 in 2014 as compared with net actuarial gains of approximately $81 in 2013. In 2014, net
actuarial losses were negatively impacted by lower discount rates for the non-U.S. and U.S. pension plans and updated mortality rates for
the U.S. pension plan, partially offset by higher asset returns in the non-U.S. and U.S. pension plans in 2014 as compared to 2013. The other
comprehensive income (loss) year-over-year comparison was also unfavorably impacted by foreign currency translation adjustments, as well
A V O N 2014 39