Avon 2014 Annual Report Download - page 61
Download and view the complete annual report
Please find page 61 of the 2014 Avon annual report below. You can navigate through the pages in the report by either clicking on the pages listed below, or by using the keyword search tool below to find specific information within the annual report.-
 1
1 -
2
-
3
-
4
-
5
-
6
-
7
-
8
-
9
-
10
-
11
-
12
-
13
-
14
-
15
-
16
-
17
-
18
-
19
-
20
-
21
-
22
-
23
-
24
-
25
-
26
-
27
-
28
-
29
-
30
-
31
-
32
-
33
-
34
-
35
-
36
-
37
-
38
-
39
-
40
-
41
-
42
-
43
-
44
-
45
-
46
-
47
-
48
-
49
-
50
-
 51
51 -
 52
52 -
 53
53 -
 54
54 -
 55
55 -
 56
56 -
 57
57 -
 58
58 -
 59
59 -
 60
60 -
 61
61 -
 62
62 -
 63
63 -
 64
64 -
 65
65 -
 66
66 -
 67
67 -
 68
68 -
 69
69 -
 70
70 -
 71
71 -
72
-
73
-
74
-
75
-
76
-
77
-
78
-
79
-
80
-
81
-
82
-
83
-
84
-
85
-
86
-
87
-
88
-
89
-
90
-
91
-
92
-
93
-
94
-
95
-
96
-
97
-
98
-
99
-
100
-
101
-
102
-
103
-
104
-
105
-
106
-
107
-
108
-
109
-
110
-
111
-
112
-
113
-
114
-
115
-
116
-
117
-
118
-
119
-
120
-
121
-
122
-
123
-
124
-
125
-
126
-
127
-
128
-
129
-
130
 |
 |

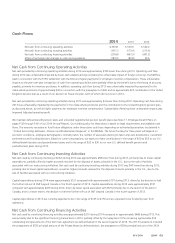
Cash Flows
2014 2013 2012
Net cash from continuing operating activities $ 359.8 $ 539.6 $ 544.0
Net cash from continuing investing activities (105.1) (173.4) (213.4)
Net cash from continuing financing activities (218.8) (467.9) (401.3)
Effect of exchange rate changes on cash and equivalents (183.3) (80.8) 23.4
Net Cash from Continuing Operating Activities
Net cash provided by continuing operating activities during 2014 was approximately $180 lower than during 2013. Operating cash flow
during 2014 was unfavorably impacted by lower cash-related earnings (including the unfavorable impact of foreign currency), the $68 fine
paid in connection with the FCPA settlement with the DOJ and higher payments for employee incentive compensation. These unfavorable
impacts to the year-over-year comparison of cash from operating activities were partially offset by the benefit due to the timing of accounts
payable, primarily for inventory purchases. In addition, operating cash flow during 2013 was unfavorably impacted by payments for the
make-whole premiums of approximately $90 in connection with the prepayment of debt and an approximate $25 contribution to the United
Kingdom pension plan as a result of our decision to freeze the plan, both of which did not recur in 2014.
Net cash provided by continuing operating activities during 2013 was approximately $4 lower than during 2012. Operating cash flow during
2013 was unfavorably impacted by the payments for the make-whole premiums and the contribution to the United Kingdom pension plan,
as discussed above, as well as higher payments for employee incentive compensation. Substantially offsetting these unfavorable impacts was
improved Adjusted operating profit.
We maintain defined benefit pension plans and unfunded supplemental pension benefit plans (see Note 11, Employee Benefit Plans on
pages F-32 through F-40 of our 2014 Annual Report). Our funding policy for these plans is based on legal requirements and available cash
flows. The amounts necessary to fund future obligations under these plans could vary depending on estimated assumptions (as detailed in
“Critical Accounting Estimates – Pension and Postretirement Expense” in this MD&A). The future funding for these plans will depend on
economic conditions, employee demographics, mortality rates, the number of associates electing to take lump-sum distributions, investment
performance and funding decisions. Based on current assumptions, we expect to make contributions in the range of $50 to $55 to our U.S.
defined benefit pension and postretirement plans and in the range of $25 to $30 to our non-U.S. defined benefit pension and
postretirement plans during 2015.
Net Cash from Continuing Investing Activities
Net cash used by continuing investing activities during 2014 was approximately $68 lower than during 2013, primarily due to lower capital
expenditures, partially offset by higher proceeds received for the disposal of assets, primarily in the U.S., due to the sale of facilities
associated with our restructuring initiatives. Net cash used by continuing investing activities during 2013 was $40 lower than during 2012,
primarily due to lower capital expenditures, as well as higher proceeds received for the disposal of assets, primarily in the U.S., due to the
sale of facilities associated with our restructuring initiatives.
Capital expenditures during 2014 were approximately $131 compared with approximately $197 during 2013, driven by the decision to halt
the further roll-out of SMT beyond Canada in the fourth quarter of 2013. Capital expenditures during 2013 were approximately $197
compared with approximately $229 during 2012, driven by lower spend associated with SMT primarily due to the launch of the pilot in
Canada, and to a lesser extent, the decision to halt the further roll-out of SMT beyond Canada in the fourth quarter of 2013.
Capital expenditures in 2015 are currently expected to be in the range of $125 to $150 and are expected to be funded by cash from
operations.
Net Cash from Continuing Financing Activities
Net cash used by continuing financing activities was approximately $219 during 2014 compared to approximately $468 during 2013. This
was primarily due to the significant financing transactions in 2013, partially offset by the repayment of the remaining approximate $53
outstanding principal amount of the term loan agreement (as defined below) in the second quarter of 2014. The 2013 transactions included
the prepayment of $535 principal amount of the Private Notes (as defined below), the prepayment of $500 principal amount of the 2014
A V O N 2014 53