Avon 2014 Annual Report Download - page 54
Download and view the complete annual report
Please find page 54 of the 2014 Avon annual report below. You can navigate through the pages in the report by either clicking on the pages listed below, or by using the keyword search tool below to find specific information within the annual report.-
 1
1 -
2
-
3
-
4
-
5
-
6
-
7
-
8
-
9
-
10
-
11
-
12
-
13
-
14
-
15
-
16
-
17
-
18
-
19
-
20
-
21
-
22
-
23
-
24
-
25
-
26
-
27
-
28
-
29
-
30
-
31
-
32
-
33
-
34
-
35
-
36
-
37
-
38
-
39
-
40
-
41
-
42
-
43
-
 44
44 -
 45
45 -
 46
46 -
 47
47 -
 48
48 -
 49
49 -
 50
50 -
 51
51 -
 52
52 -
 53
53 -
 54
54 -
 55
55 -
 56
56 -
 57
57 -
 58
58 -
 59
59 -
 60
60 -
 61
61 -
 62
62 -
 63
63 -
 64
64 -
65
-
66
-
67
-
68
-
69
-
70
-
71
-
72
-
73
-
74
-
75
-
76
-
77
-
78
-
79
-
80
-
81
-
82
-
83
-
84
-
85
-
86
-
87
-
88
-
89
-
90
-
91
-
92
-
93
-
94
-
95
-
96
-
97
-
98
-
99
-
100
-
101
-
102
-
103
-
104
-
105
-
106
-
107
-
108
-
109
-
110
-
111
-
112
-
113
-
114
-
115
-
116
-
117
-
118
-
119
-
120
-
121
-
122
-
123
-
124
-
125
-
126
-
127
-
128
-
129
-
130
 |
 |

PART II
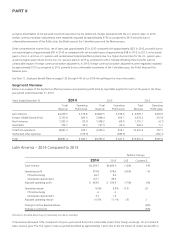
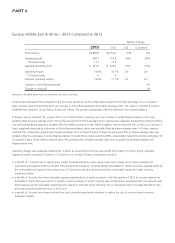
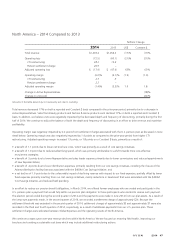
Europe, Middle East & Africa – 2013 Compared to 2012
%/Point Change
2013 2012 US$ Constant $
Total revenue $2,898.4 $2,914.2 (1)% 2%
Operating profit 406.7 312.8 30% 34%
CTI restructuring 17.7 11.8
Adjusted operating profit $ 424.4 $ 324.6 31% 35%
Operating margin 14.0% 10.7% 3.3 3.4
CTI restructuring .6 .4
Adjusted operating margin 14.6% 11.1% 3.5 3.6
Change in Active Representatives 1%
Change in units sold –%
Amounts in the table above may not necessarily sum due to rounding.
Total revenue decreased 1% compared to the prior-year period due to the unfavorable impact from foreign exchange. On a Constant $
basis, revenue grew 2% primarily due to an increase in Active Representatives and higher average order. The region’s Constant $ revenue
benefited from growth in South Africa, Russia and Turkey. This growth was partially offset by a decline in the United Kingdom.
In Russia, revenue declined 1%, or grew 2% on a Constant $ basis, primarily due to an increase in Active Representatives, which was
partially offset by lower average order. During the second half of 2013, average order in Russia was negatively impacted by product portfolio
mix and merchandising execution coupled with the weaker economy. In the United Kingdom, revenue declined 6%, or 5% on a Constant $
basis, negatively impacted by a decrease in Active Representatives, which was partially offset by higher average order. In Turkey, revenue
declined 5%, unfavorably impacted by foreign exchange. On a Constant $ basis, Turkey’s revenue grew 2%, as higher average order was
partially offset by a decrease in Active Representatives. In South Africa, revenue declined 8%, unfavorably impacted by foreign exchange. On
a Constant $ basis, South Africa’s revenue grew 9%, primarily due to higher average order from successful marketing strategies and
Representative mix.
Operating margin was negatively impacted by .2 points as compared to the prior-year period from higher CTI restructuring. Adjusted
operating margin increased 3.5 points, or 3.6 points on a Constant $ basis, primarily as a result of:
• a benefit of 1.9 points due to higher gross margin caused primarily by lower supply chain costs, largely due to lower material and
overhead costs together with the benefits from productivity initiatives, including facility rationalization. These items were partially offset by
the unfavorable net impact of mix and pricing of .5 points as a result of discounts and the unfavorable impact of foreign currency
transaction losses;
• a benefit of .9 points from lower bad debt expense partially due to a higher provision in the first quarter of 2012 to increase reserves for
bad debts in South Africa as a result of growth in new territories, of which .5 points was an adjustment associated with prior periods. Bad
debt expense was also favorably impacted by the change in estimate of the collection of our receivables which increased bad debt in the
prior-year period that did not recur in 2013; and
• a benefit of .5 points from lower net brochure costs, partially impacted by initiatives to reduce the cost of our brochures in various
European markets.