Avon 2014 Annual Report Download - page 125
Download and view the complete annual report
Please find page 125 of the 2014 Avon annual report below. You can navigate through the pages in the report by either clicking on the pages listed below, or by using the keyword search tool below to find specific information within the annual report.-
 1
1 -
2
-
3
-
4
-
5
-
6
-
7
-
8
-
9
-
10
-
11
-
12
-
13
-
14
-
15
-
16
-
17
-
18
-
19
-
20
-
21
-
22
-
23
-
24
-
25
-
26
-
27
-
28
-
29
-
30
-
31
-
32
-
33
-
34
-
35
-
36
-
37
-
38
-
39
-
40
-
41
-
42
-
43
-
44
-
45
-
46
-
47
-
48
-
49
-
50
-
51
-
52
-
53
-
54
-
55
-
56
-
57
-
58
-
59
-
60
-
61
-
62
-
63
-
64
-
65
-
66
-
67
-
68
-
69
-
70
-
71
-
72
-
73
-
74
-
75
-
76
-
77
-
78
-
79
-
80
-
81
-
82
-
83
-
84
-
85
-
86
-
87
-
88
-
89
-
90
-
91
-
92
-
93
-
94
-
95
-
96
-
97
-
98
-
99
-
100
-
101
-
102
-
103
-
104
-
105
-
106
-
107
-
108
-
109
-
110
-
111
-
112
-
113
-
114
-
 115
115 -
 116
116 -
 117
117 -
 118
118 -
 119
119 -
 120
120 -
 121
121 -
 122
122 -
 123
123 -
 124
124 -
 125
125 -
 126
126 -
 127
127 -
 128
128 -
 129
129 -
 130
130
 |
 |

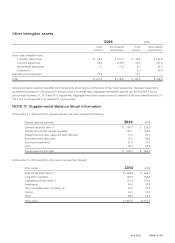
Other intangible assets
2014 2013
Gross
Amount
Accumulated
Amortization
Gross
Amount
Accumulated
Amortization
Finite-Lived Intangible Assets
Customer relationships $ 33.0 $ (31.1) $ 39.9 $ (36.5)
Licensing agreements 43.4 (39.9) 52.3 (47.3)
Noncompete agreements 7.2 (7.2) 8.1 (8.1)
Trademarks – – 6.6 (6.6)
Indefinite-Lived Trademarks 23.6 – 25.1 –
Total $ 107.2 $ (78.2) $ 132.0 $ (98.5)
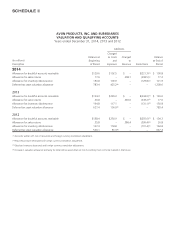
Actual amortization expense may differ from the amounts above due to, among other things, future acquisitions, disposals, impairments,
accelerated amortization or fluctuations in foreign currency exchange rates. Aggregate amortization expense was $4.4 and $9.5 for the
years ended December 31, 2013 and 2012, respectively. Aggregate amortization expense was not material for the year ended December 31,
2014, and is not expected to be material for future periods.
NOTE 17. Supplemental Balance Sheet Information
At December 31, 2014 and 2013, prepaid expenses and other included the following:
Prepaid expenses and other 2014 2013
Deferred tax assets (Note 7) $ 204.7 $ 233.6
Prepaid taxes and tax refunds receivable 165.7 145.9
Prepaid brochure costs, paper and other literature 77.6 95.7
Receivables other than trade 72.5 86.6
Short-term investments 21.0 31.7
Other 76.8 95.8
Prepaid expenses and other $ 618.3 $ 689.3
At December 31, 2014 and 2013, other assets included the following:
Other assets 2014 2013
Deferred tax assets (Note 7) $ 685.8 $ 944.7
Long-term receivables 149.5 168.0
Capitalized software (Note 1) 101.3 122.9
Investments 36.4 33.8
Other intangible assets, net (Note 16) 29.0 33.5
Tooling 21.7 37.9
Other 28.3 34.5
Other assets $1,052.0 $1,375.3
A V O N 2014 F-51