Avon 2014 Annual Report Download - page 103
Download and view the complete annual report
Please find page 103 of the 2014 Avon annual report below. You can navigate through the pages in the report by either clicking on the pages listed below, or by using the keyword search tool below to find specific information within the annual report.-
 1
1 -
2
-
3
-
4
-
5
-
6
-
7
-
8
-
9
-
10
-
11
-
12
-
13
-
14
-
15
-
16
-
17
-
18
-
19
-
20
-
21
-
22
-
23
-
24
-
25
-
26
-
27
-
28
-
29
-
30
-
31
-
32
-
33
-
34
-
35
-
36
-
37
-
38
-
39
-
40
-
41
-
42
-
43
-
44
-
45
-
46
-
47
-
48
-
49
-
50
-
51
-
52
-
53
-
54
-
55
-
56
-
57
-
58
-
59
-
60
-
61
-
62
-
63
-
64
-
65
-
66
-
67
-
68
-
69
-
70
-
71
-
72
-
73
-
74
-
75
-
76
-
77
-
78
-
79
-
80
-
81
-
82
-
83
-
84
-
85
-
86
-
87
-
88
-
89
-
90
-
91
-
92
-
 93
93 -
 94
94 -
 95
95 -
 96
96 -
 97
97 -
 98
98 -
 99
99 -
 100
100 -
 101
101 -
 102
102 -
 103
103 -
 104
104 -
 105
105 -
 106
106 -
 107
107 -
 108
108 -
 109
109 -
 110
110 -
 111
111 -
 112
112 -
 113
113 -
114
-
115
-
116
-
117
-
118
-
119
-
120
-
121
-
122
-
123
-
124
-
125
-
126
-
127
-
128
-
129
-
130
 |
 |

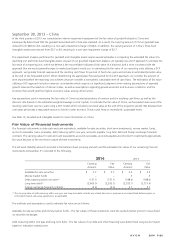
September 30, 2013 – China
In the third quarter of 2013, we completed an interim impairment assessment of the fair value of goodwill related to China and
subsequently determined that the goodwill associated with China was impaired. As a result, the carrying amount of China’s goodwill was
reduced from $38.4 to $0, resulting in a non-cash impairment charge of $38.4. In addition, the carrying amount of China’s finite-lived
intangible assets was reduced from $3.7 to $0, resulting in a non-cash impairment charge of $3.7.
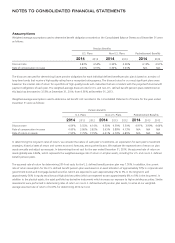
The impairment analyses performed for goodwill and intangible assets require several estimates in computing the estimated fair value of a
reporting unit and finite-lived intangible assets. As part of our goodwill impairment analysis, we typically use a DCF approach to estimate the
fair value of a reporting unit, which we believe is the most reliable indicator of fair value of a business, and is most consistent with the
approach that we would generally expect a market participant would use. In estimating the fair value of our reporting units utilizing a DCF
approach, we typically forecast revenue and the resulting cash flows for periods of five to ten years and include an estimated terminal value
at the end of the forecasted period. When determining the appropriate forecast period for the DCF approach, we consider the amount of
time required before the reporting unit achieves what we consider a normalized, sustainable level of cash flows. The estimation of fair value
utilizing a DCF approach includes numerous uncertainties which require our significant judgment when making assumptions of expected
growth rates and the selection of discount rates, as well as assumptions regarding general economic and business conditions, and the
structure that would yield the highest economic value, among other factors.
Key assumptions used in measuring the fair value of China included projections of revenue and the resulting cash flows, as well as the
discount rate (based on the estimated weighted-average cost of capital). To estimate the fair value of China, we forecasted revenue and the
resulting cash flows over ten years using a DCF model which included a terminal value at the end of the projection period. We believed that
a ten-year period was a reasonable amount of time in order to return China’s cash flows to normalized, sustainable levels.
See Note 16, Goodwill and Intangible Assets for more information on China.
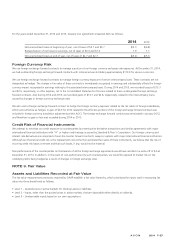
Fair Value of Financial Instruments
Our financial instruments include cash and cash equivalents, available-for-sale securities, short-term investments, money market funds,
accounts receivable, loans receivable, debt maturing within one year, accounts payable, long-term debt and foreign exchange forwards
contracts. The carrying value for cash and cash equivalents, accounts receivable, accounts payable and short-term investments approximate
fair value because of the short-term nature of these instruments.
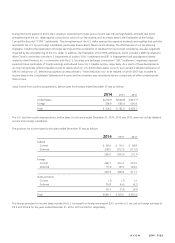
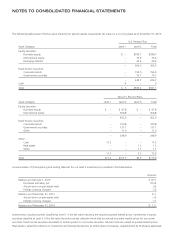
The net asset (liability) amounts recorded in the balance sheet (carrying amount) and the estimated fair values of our remaining financial
instruments at December 31 consisted of the following:
2014 2013
Carrying
Amount
Fair
Value
Carrying
Amount
Fair
Value
Available-for-sale securities $ 2.7 $ 2.7 $ 2.5 $ 2.5
Money market funds – – .5 .5
Debt maturing within one year(1) (137.1) (137.1) (188.0) (188.0)
Long-term debt(1) (2,463.9) (2,242.5) (2,532.7) (2,511.6)
Foreign exchange forward contracts (4.4) (4.4) 3.1 3.1
(1) The carrying value of debt maturing within one year and long-term debt includes any related discount or premium and unamortized deferred gains on
terminated interest-rate swap agreements, as applicable.
The methods and assumptions used to estimate fair value are as follows:
Available-for-sale securities and money market funds – The fair values of these investments were the quoted market prices for issues listed
on securities exchanges.
Debt maturing within one year and long-term debt – The fair values of our debt and other financing were determined using Level 2 inputs
based on indicative market prices.
A V O N 2014 F-29