Avon 2014 Annual Report Download - page 112
Download and view the complete annual report
Please find page 112 of the 2014 Avon annual report below. You can navigate through the pages in the report by either clicking on the pages listed below, or by using the keyword search tool below to find specific information within the annual report.-
 1
1 -
2
-
3
-
4
-
5
-
6
-
7
-
8
-
9
-
10
-
11
-
12
-
13
-
14
-
15
-
16
-
17
-
18
-
19
-
20
-
21
-
22
-
23
-
24
-
25
-
26
-
27
-
28
-
29
-
30
-
31
-
32
-
33
-
34
-
35
-
36
-
37
-
38
-
39
-
40
-
41
-
42
-
43
-
44
-
45
-
46
-
47
-
48
-
49
-
50
-
51
-
52
-
53
-
54
-
55
-
56
-
57
-
58
-
59
-
60
-
61
-
62
-
63
-
64
-
65
-
66
-
67
-
68
-
69
-
70
-
71
-
72
-
73
-
74
-
75
-
76
-
77
-
78
-
79
-
80
-
81
-
82
-
83
-
84
-
85
-
86
-
87
-
88
-
89
-
90
-
91
-
92
-
93
-
94
-
95
-
96
-
97
-
98
-
99
-
100
-
101
-
 102
102 -
 103
103 -
 104
104 -
 105
105 -
 106
106 -
 107
107 -
 108
108 -
 109
109 -
 110
110 -
 111
111 -
 112
112 -
 113
113 -
 114
114 -
 115
115 -
 116
116 -
 117
117 -
 118
118 -
 119
119 -
 120
120 -
 121
121 -
 122
122 -
123
-
124
-
125
-
126
-
127
-
128
-
129
-
130
 |
 |

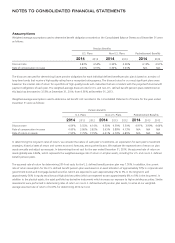
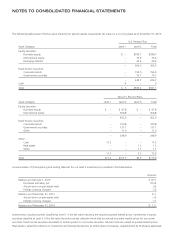
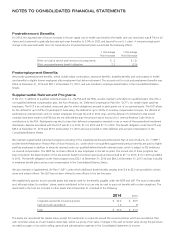
NOTES TO CONSOLIDATED FINANCIAL STATEMENTS
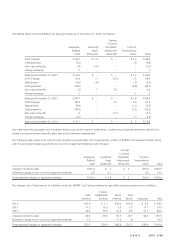
The following tables present the fair value hierarchy for pension assets measured at fair value on a recurring basis as of December 31, 2013:
U.S. Pension Plan
Asset Category Level 1 Level 2 Total
Equity Securities:
Domestic equity $ – $186.7 $186.7
International equity – 75.4 75.4
Emerging markets – 43.4 43.4
– 305.5 305.5
Fixed Income Securities:
Corporate bonds – 154.0 154.0
Government securities – 70.7 70.7
– 224.7 224.7
Cash .9 – .9
Total $ .9 $530.2 $531.1
Non-U.S. Pension Plans
Asset Category Level 1 Level 2 Level 3 Total
Equity Securities:
Domestic equity $ – $ 97.8 $ – $ 97.8
International equity – 354.8 – 354.8
– 452.6 – 452.6
Fixed Income Securities:
Corporate bonds – 100.8 – 100.8
Government securities – 137.1 – 137.1
Other – 11.0 – 11.0
– 248.9 – 248.9
Other:
Cash 11.2 – – 11.2
Real estate – – 1.2 1.2
Other – – 1.1 1.1
11.2 – 2.3 13.5
Total $11.2 $701.5 $2.3 $715.0
A reconciliation of the beginning and ending balances for our Level 3 investments is provided in the table below:
Amount
Balance as of January 1, 2013 $ 13.5
Purchases and sales, net (10.4)
Actual return on plan assets held (.5)
Foreign currency changes (.3)
Balance as of December 31, 2013 2.3
Actual return on plan assets held (.3)
Foreign currency changes (.1)
Balance as of December 31, 2014 $ 1.9
Investments in equity securities classified as Level 1 in the fair value hierarchy are valued at quoted market prices. Investments in equity
securities classified as Level 2 in the fair value hierarchy include collective funds that are valued at quoted market prices for non-active
securities. Fixed income securities are based on broker quotes for non-active securities. Mutual funds are valued at quoted market prices.
Real estate is valued by reference to investment and leasing transactions at similar types of property, supplemented by third party appraisals.