Avon 2014 Annual Report Download - page 49
Download and view the complete annual report
Please find page 49 of the 2014 Avon annual report below. You can navigate through the pages in the report by either clicking on the pages listed below, or by using the keyword search tool below to find specific information within the annual report.-
 1
1 -
2
-
3
-
4
-
5
-
6
-
7
-
8
-
9
-
10
-
11
-
12
-
13
-
14
-
15
-
16
-
17
-
18
-
19
-
20
-
21
-
22
-
23
-
24
-
25
-
26
-
27
-
28
-
29
-
30
-
31
-
32
-
33
-
34
-
35
-
36
-
37
-
38
-
 39
39 -
 40
40 -
 41
41 -
 42
42 -
 43
43 -
 44
44 -
 45
45 -
 46
46 -
 47
47 -
 48
48 -
 49
49 -
 50
50 -
 51
51 -
 52
52 -
 53
53 -
 54
54 -
 55
55 -
 56
56 -
 57
57 -
 58
58 -
 59
59 -
60
-
61
-
62
-
63
-
64
-
65
-
66
-
67
-
68
-
69
-
70
-
71
-
72
-
73
-
74
-
75
-
76
-
77
-
78
-
79
-
80
-
81
-
82
-
83
-
84
-
85
-
86
-
87
-
88
-
89
-
90
-
91
-
92
-
93
-
94
-
95
-
96
-
97
-
98
-
99
-
100
-
101
-
102
-
103
-
104
-
105
-
106
-
107
-
108
-
109
-
110
-
111
-
112
-
113
-
114
-
115
-
116
-
117
-
118
-
119
-
120
-
121
-
122
-
123
-
124
-
125
-
126
-
127
-
128
-
129
-
130
 |
 |
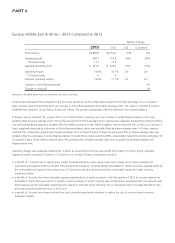
Brazil. In addition, higher average order was partially offset by a decrease in Active Representatives. Average order benefited from pricing,
including inflationary impacts, primarily in Venezuela. Revenue in Venezuela and Mexico declined 55% and 9%, respectively, which were
unfavorably impacted by foreign exchange, and Constant $ revenue in Venezuela and Mexico increased 45% and declined 6%, respectively.
Revenue in Brazil declined 5%, which was unfavorably impacted by foreign exchange, and Constant $ revenue in Brazil increased 3%.
Brazil’s revenue benefited by approximately 3 points as a result of the net impact of certain tax benefits.
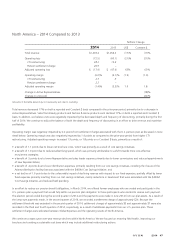
In 2014, our Constant $ revenue growth and Constant $ operating profit growth were not impacted by the use of the SICAD II exchange
rate as we applied the exchange rate of 6.30 to current and prior periods for our Venezuela operations in order to determine Constant $
growth. If we had used an exchange rate of 50 (which is a rate more reflective of the SICAD II rate) for our Venezuela operations for the
year ended December 31, 2014, the region’s Constant $ revenue would have been an increase of 1% from the prior-year period, the
region’s Constant $ Adjusted operating margin would have been a decrease of .8 points from the prior-year period, and Avon’s consolidated
Constant $ revenue decline would have been a decrease of 2% from the prior-year period. As we update our Constant $ rates on an annual
basis, we will utilize a rate of approximately 50 in our Constant $ financial performance beginning with our 2015 results. See below for
further discussion regarding the impact of the Venezuelan currency devaluation.
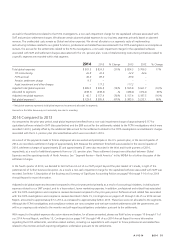
Brazil’s Constant $ revenue benefited by approximately 3 points due to the net benefit of larger tax credits recognized in 2014 as compared
to the benefit and tax credits recognized in 2013. In 2014 and 2013, we recognized tax credits in Brazil of approximately $85 and
approximately $29, respectively, primarily associated with a change in estimate of expected recoveries of VAT. Of the VAT credits recognized
in 2014, approximately $13 were out-of-period adjustments. As the tax credits are associated with VAT, which is recorded as a reduction to
revenue, the benefit from these VAT credits is recognized as revenue. Brazil’s Active Representatives and average order were relatively
unchanged from the prior-year period. On a Constant $ basis, Brazil’s sales from both Beauty and Fashion & Home products were relatively
unchanged.
Mexico’s Constant $ revenue decline was primarily due to a decrease in Active Representatives, partially offset by higher average order.
Constant $ revenue growth in Venezuela was primarily due to higher average order, partially offset by a decrease in Active Representatives.
Venezuela’s average order benefited from the inflationary impact on pricing that was partially offset by a decrease in units sold. Venezuela’s
Active Representatives and units sold were negatively impacted by the reduced size of our product offering, primarily the result of our
increased difficulty to import products and raw materials. Additional information on our Venezuela operations is discussed in more detail
below.
Operating margin was negatively impacted by 2.2 points as compared to the prior-year period due to a larger impact in 2014 of the
Venezuelan special items in conjunction with highly inflationary accounting as discussed further below. Operating margin was also
negatively impacted by .4 points as compared to the prior-year period from higher CTI restructuring. Adjusted operating margin decreased
.6 points, or increased .1 points on a Constant $ basis, primarily as a result of:
• a benefit of 1.1 points from lower Representative, sales leader and field expense, which was primarily attributable to a shift towards more
cost-effective incentives;
• a benefit of 1.0 point associated with the net impact of the incremental tax credits in Brazil recognized as revenue in 2014 and 2013,
discussed above;
• a benefit of .3 points from lower net brochure costs, driven by Venezuela as a result of cost savings initiatives;
• a decline of .8 points due to lower gross margin caused primarily by 1.4 points from the unfavorable impact of foreign currency
transaction losses, primarily in Venezuela, and .9 points from higher supply chain costs, which was driven by higher obsolescence primarily
in Venezuela and Brazil. These items were partially offset by 1.8 points from the favorable net impact of mix and pricing. Benefits from
pricing include the realization of price increases in markets experiencing relatively high inflation (Venezuela and Argentina) on inventory
acquired in advance of such inflation;
• a decline of .8 points from higher distribution expenses, driven by inflation in Venezuela and Argentina and other cost pressures in the
region; and
• a decline of .7 points from higher administrative expenses, partially driven by inflationary costs, and increased legal expenses associated
with labor and civil related matters in Brazil.
We expect the environment in Latin America to continue to be challenging in the near term with a weak economy and high levels of
competition.
A V O N 2014 41