Avon 2014 Annual Report Download - page 57
Download and view the complete annual report
Please find page 57 of the 2014 Avon annual report below. You can navigate through the pages in the report by either clicking on the pages listed below, or by using the keyword search tool below to find specific information within the annual report.-
 1
1 -
2
-
3
-
4
-
5
-
6
-
7
-
8
-
9
-
10
-
11
-
12
-
13
-
14
-
15
-
16
-
17
-
18
-
19
-
20
-
21
-
22
-
23
-
24
-
25
-
26
-
27
-
28
-
29
-
30
-
31
-
32
-
33
-
34
-
35
-
36
-
37
-
38
-
39
-
40
-
41
-
42
-
43
-
44
-
45
-
46
-
 47
47 -
 48
48 -
 49
49 -
 50
50 -
 51
51 -
 52
52 -
 53
53 -
 54
54 -
 55
55 -
 56
56 -
 57
57 -
 58
58 -
 59
59 -
 60
60 -
 61
61 -
 62
62 -
 63
63 -
 64
64 -
 65
65 -
 66
66 -
 67
67 -
68
-
69
-
70
-
71
-
72
-
73
-
74
-
75
-
76
-
77
-
78
-
79
-
80
-
81
-
82
-
83
-
84
-
85
-
86
-
87
-
88
-
89
-
90
-
91
-
92
-
93
-
94
-
95
-
96
-
97
-
98
-
99
-
100
-
101
-
102
-
103
-
104
-
105
-
106
-
107
-
108
-
109
-
110
-
111
-
112
-
113
-
114
-
115
-
116
-
117
-
118
-
119
-
120
-
121
-
122
-
123
-
124
-
125
-
126
-
127
-
128
-
129
-
130
 |
 |

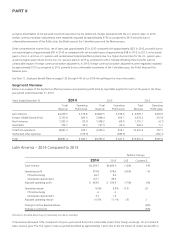
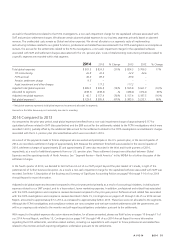
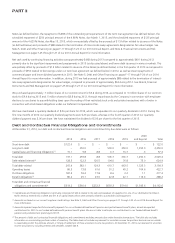
Asia Pacific – 2014 Compared to 2013
%/Point Change
2014 2013 US$ Constant $
Total revenue $702.7 $757.9 (7)% (4)%
Operating profit (loss) 20.9 (12.1) * *
CTI restructuring 9.3 5.0
Asset impairment and other charges – 42.1
Adjusted operating profit $ 30.2 $ 35.0 (14)% –%
Operating margin 3.0% (1.6)% 4.6 5.2
CTI restructuring 1.3 .7
Asset impairment and other charges – 5.6
Adjusted operating margin 4.3% 4.6% (.3) .1
Change in Active Representatives(1) (7)%
Change in units sold (2)%
(1) Excludes China.
* Calculation not meaningful
Amounts in the table above may not necessarily sum due to rounding.
Total revenue decreased 7% compared to the prior-year period, partially due to the unfavorable impact from foreign exchange. On a
Constant $ basis, revenue decreased 4%, as an increase in the Philippines was more than offset by declines in the other Asia Pacific markets.
Constant $ revenue was also impacted by a decrease in Active Representatives, partially offset by higher average order. Revenue in the
Philippines declined 2%, which was unfavorably impacted by foreign exchange. On a Constant $ basis, revenue in the Philippines increased
3%, as higher average order was partially offset by a decrease in Active Representatives. Revenue in China declined 10% on both a reported
and Constant $ basis, primarily due to a decline in the number of beauty boutiques. The decline in the number of beauty boutiques
negatively impacted unit sales, but was partially offset by actions taken during the second half of 2013 which were intended to reduce
inventory levels held by the beauty boutiques that did not recur in 2014.
Operating margin benefited by 5.6 points as compared to the prior-year period due to the impact of non-cash goodwill and intangible asset
impairment charges associated with our China business as discussed in more detail below. Operating margin was negatively impacted by .6
points as compared to the prior-year period from higher CTI restructuring. Adjusted operating margin decreased .3 points, or increased .1
point on a Constant $ basis, primarily as a result of:
• a benefit of 1.3 points from lower bad debt expense, primarily as our 2013 results included an adjustment associated with prior periods in
the Philippines;
• a net benefit of .9 points due to lower fixed expenses, which was partially offset by the unfavorable impact of declining revenue with
respect to our fixed expenses. Lower fixed expenses primarily resulted from our cost savings initiatives, mainly reductions in headcount
that were associated with the $400M Cost Savings Initiative;
• a decline of 1.2 points due to lower gross margin caused primarily by .7 points from the unfavorable net impact of pricing and mix
primarily driven by the Philippines largely due to unit driving offers, and .6 points from the unfavorable impact of foreign currency
transaction losses; and
• a decline of .9 points due to higher advertising spend, primarily in China to support product re-launches.
A V O N 2014 49