Avon 2014 Annual Report Download - page 105
Download and view the complete annual report
Please find page 105 of the 2014 Avon annual report below. You can navigate through the pages in the report by either clicking on the pages listed below, or by using the keyword search tool below to find specific information within the annual report.-
 1
1 -
2
-
3
-
4
-
5
-
6
-
7
-
8
-
9
-
10
-
11
-
12
-
13
-
14
-
15
-
16
-
17
-
18
-
19
-
20
-
21
-
22
-
23
-
24
-
25
-
26
-
27
-
28
-
29
-
30
-
31
-
32
-
33
-
34
-
35
-
36
-
37
-
38
-
39
-
40
-
41
-
42
-
43
-
44
-
45
-
46
-
47
-
48
-
49
-
50
-
51
-
52
-
53
-
54
-
55
-
56
-
57
-
58
-
59
-
60
-
61
-
62
-
63
-
64
-
65
-
66
-
67
-
68
-
69
-
70
-
71
-
72
-
73
-
74
-
75
-
76
-
77
-
78
-
79
-
80
-
81
-
82
-
83
-
84
-
85
-
86
-
87
-
88
-
89
-
90
-
91
-
92
-
93
-
94
-
 95
95 -
 96
96 -
 97
97 -
 98
98 -
 99
99 -
 100
100 -
 101
101 -
 102
102 -
 103
103 -
 104
104 -
 105
105 -
 106
106 -
 107
107 -
 108
108 -
 109
109 -
 110
110 -
 111
111 -
 112
112 -
 113
113 -
 114
114 -
 115
115 -
116
-
117
-
118
-
119
-
120
-
121
-
122
-
123
-
124
-
125
-
126
-
127
-
128
-
129
-
130
 |
 |

The weighted-average grant-date fair values per share of options granted were $3.55 during 2012.
A summary of stock options as of December 31, 2014, and changes during 2014, is as follows:
Shares
(in 000’s)
Weighted-
Average
Exercise
Price
Weighted-
Average
Contractual
Term
Aggregate
Intrinsic
Value
Outstanding at January 1, 2014 21,543 $32.27
Granted – –
Exercised (12) 15.50
Forfeited (59) 18.29
Expired (4,314) 34.68
Outstanding at December 31, 2014 17,158 $31.74 3.0 $ –
Exercisable at December 31, 2014 16,156 $31.81 2.9 $ –
At December 31, 2014, there was approximately $.1 of unrecognized compensation cost related to stock options outstanding, which is
expected to be recognized in 2015. We recognize expense on stock options using a graded vesting method, which recognizes the associated
expense based on the timing of option vesting dates.
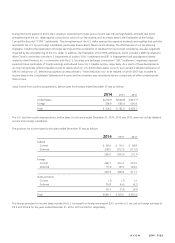
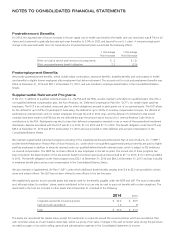
Cash proceeds, tax obligations and intrinsic value related to total stock options exercised during 2014, 2013 and 2012, were as follows:
2014 2013 2012
Cash proceeds from stock options exercised $ .2 $19.4 $ 8.6
Tax obligation realized for stock options exercised – (1.8) (3.7)
Intrinsic value of stock options exercised – 6.4 2.2
Restricted Stock, Restricted Stock Units and Performance Restricted Stock Units
The fair value of restricted stock units and performance restricted stock units granted was determined based on the closing price of our
common stock on the date of grant.
In 2012, we granted performance restricted stock units that would vest and settle after three years only upon the satisfaction of certain
performance conditions. Several weeks after the original grant date, we amended one of these performance conditions associated with this
award. As a result, the incremental compensation cost associated with this modification totaled $.9, of which $.3 was recognized in 2012.
We accrue compensation cost if it is probable that the performance conditions will be achieved and reassess whether achievement of the
performance conditions are probable at each reporting period. We have assessed that it is no longer probable that we would meet the
specified performance conditions, and reversed the compensation cost recognized to-date.
In 2013, we granted performance restricted stock units that would vest and settle after three years only upon the satisfaction of certain
performance conditions. We have adjusted the compensation cost recognized to-date to reflect our estimated performance.
In 2014, we granted performance restricted stock units that would vest and settle after three years only upon the satisfaction of certain
performance conditions. We currently believe that the achievement of the performance conditions is probable.
A V O N 2014 F-31