Avon 2014 Annual Report Download - page 31
Download and view the complete annual report
Please find page 31 of the 2014 Avon annual report below. You can navigate through the pages in the report by either clicking on the pages listed below, or by using the keyword search tool below to find specific information within the annual report.-
 1
1 -
2
-
3
-
4
-
5
-
6
-
7
-
8
-
9
-
10
-
11
-
12
-
13
-
14
-
15
-
16
-
17
-
18
-
19
-
20
-
 21
21 -
 22
22 -
 23
23 -
 24
24 -
 25
25 -
 26
26 -
 27
27 -
 28
28 -
 29
29 -
 30
30 -
 31
31 -
 32
32 -
 33
33 -
 34
34 -
 35
35 -
 36
36 -
 37
37 -
 38
38 -
 39
39 -
 40
40 -
 41
41 -
42
-
43
-
44
-
45
-
46
-
47
-
48
-
49
-
50
-
51
-
52
-
53
-
54
-
55
-
56
-
57
-
58
-
59
-
60
-
61
-
62
-
63
-
64
-
65
-
66
-
67
-
68
-
69
-
70
-
71
-
72
-
73
-
74
-
75
-
76
-
77
-
78
-
79
-
80
-
81
-
82
-
83
-
84
-
85
-
86
-
87
-
88
-
89
-
90
-
91
-
92
-
93
-
94
-
95
-
96
-
97
-
98
-
99
-
100
-
101
-
102
-
103
-
104
-
105
-
106
-
107
-
108
-
109
-
110
-
111
-
112
-
113
-
114
-
115
-
116
-
117
-
118
-
119
-
120
-
121
-
122
-
123
-
124
-
125
-
126
-
127
-
128
-
129
-
130
 |
 |
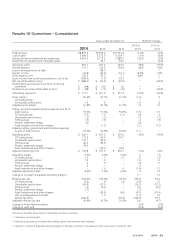
charge of $23.5. Because the settlement threshold was exceeded in the second quarter of 2014, settlement charges of $5.4 and $7.5 were also recorded in
the third and fourth quarters of 2014, respectively, as a result of additional payments from our U.S. pension plan. These settlement charges were allocated
between Global Expenses and the operating results of North America. See “Segment Review – North America” within MD&A on pages 47 through 48, and
Note 11, Employee Benefit Plans on pages F-32 through F-40 of our 2014 Annual Report for a further discussion of the settlement charges.
(5) During 2013 and 2012, our operating profit and operating margin were negatively impacted by non-cash impairment charges associated with goodwill and
intangible assets of our China business. In addition, during 2013, our operating profit and operating margin was negatively impacted by the non-cash
impairment charge associated with capitalized software related to our Service Model Transformation (“SMT”) project in the fourth quarter of 2013. See Note
16, Goodwill and Intangible Assets on pages F-49 through F-51 of our 2014 Annual Report for more information on China and Note 1, Description of the
Business and Summary of Significant Accounting Policies on pages F-8 through F-14 of our 2014 Annual Report for more information on SMT.
ITEM 7. MANAGEMENT’S DISCUSSION AND ANALYSIS OF FINANCIAL CONDITION
AND RESULTS OF OPERATIONS (“MD&A”)
(U.S. dollars in millions, except per share and share data)
You should read the following discussion of the results of operations and financial condition of Avon Products, Inc. and its majority and
wholly owned subsidiaries in conjunction with the information contained in the Consolidated Financial Statements and related Notes
contained in our 2014 Annual Report. When used in this discussion, the terms “Avon,” “Company,” “we,” “our” or “us” mean, unless the
context otherwise indicates, Avon Products, Inc. and its majority and wholly owned subsidiaries.
See “Non-GAAP Financial Measures” on pages 25 through 27 of this MD&A for a description of how Constant dollar (“Constant $”)
growth rates (a Non-GAAP financial measure) are determined.
Overview
We are a global manufacturer and marketer of beauty and related products. Our business is conducted worldwide, primarily in the direct-
selling channel. As of December 31, 2014, we had sales operations in 60 countries and territories, including the United States (“U.S.”), and
distributed products in 41 more. Our reportable segments are based on geographic operations and include commercial business units in
Latin America; Europe, Middle East & Africa; North America; and Asia Pacific. Our product categories are Beauty and Fashion & Home.
Beauty consists of skincare (which includes personal care), fragrance and color (cosmetics). Fashion & Home consists of fashion jewelry,
watches, apparel, footwear, accessories, gift and decorative products, housewares, entertainment and leisure products, children’s products
and nutritional products. Sales are made to the ultimate consumer principally through direct selling by Representatives, who are
independent contractors and not our employees. At December 31, 2014, we had approximately 6 million active Representatives. The success
of our business is highly dependent on recruiting, retaining and servicing our Representatives. During 2014, approximately 89% of our
consolidated revenue was derived from operations outside of the U.S.
Total revenue in 2014 compared to 2013 declined 11% compared to the prior-year period, due to unfavorable foreign exchange. Constant
$ revenue was relatively unchanged, as a 5% decrease in Active Representatives was partially offset by higher average order. Units sold
decreased 5% while the net impact of price and mix increased 5%, as pricing benefited from inflationary impacts in Latin America, primarily
in Argentina and Venezuela. Sales from the Beauty category decreased 12%, or were relatively unchanged on a Constant $ basis. Sales from
the Fashion & Home category decreased 12%, or 2% on a Constant $ basis.
During 2014, our Constant $ revenue was impacted by net declines in North America and to a lesser extent, Asia Pacific, which were
partially offset by net growth in Latin America and Europe, Middle East & Africa. North America continued to experience year-over-year
revenue declines, driven by a decrease in Active Representatives. Constant $ revenue growth in Latin America was primarily driven by
Venezuela largely due to inflationary pricing, which was partially offset by declines in Mexico. Constant $ revenue growth in Europe, Middle
East & Africa was driven by South Africa and the United Kingdom, which was partially offset by revenue declines in Russia and Turkey.
Constant $ revenue in Russia was negatively impacted by a difficult economy, including the impact of geopolitical uncertainties, and its
decline in the first half of 2014 was partially offset by Constant $ revenue growth in the second half of 2014 driven by actions to improve
unit sales. In Asia Pacific, Constant $ revenue declined as compared to 2013 as growth in the Philippines was more than offset by declines in
the other Asia Pacific markets. See “Segment Review” of this MD&A for additional information related to changes in revenue by segment.
During 2014, foreign currency had a significant impact on our financial results. As the U.S. dollar has strengthened relative to currencies of
key Avon markets, our revenue and profits have been reduced when translated into U.S. dollars and our margins have been negatively
impacted by country mix, as certain of our higher margin markets experienced significant devaluation of their local currency. In addition, as
our sales and costs are often denominated in different currencies, this has created a negative foreign currency transaction impact.
A V O N 2014 23