Avon 2014 Annual Report Download - page 116
Download and view the complete annual report
Please find page 116 of the 2014 Avon annual report below. You can navigate through the pages in the report by either clicking on the pages listed below, or by using the keyword search tool below to find specific information within the annual report.-
 1
1 -
2
-
3
-
4
-
5
-
6
-
7
-
8
-
9
-
10
-
11
-
12
-
13
-
14
-
15
-
16
-
17
-
18
-
19
-
20
-
21
-
22
-
23
-
24
-
25
-
26
-
27
-
28
-
29
-
30
-
31
-
32
-
33
-
34
-
35
-
36
-
37
-
38
-
39
-
40
-
41
-
42
-
43
-
44
-
45
-
46
-
47
-
48
-
49
-
50
-
51
-
52
-
53
-
54
-
55
-
56
-
57
-
58
-
59
-
60
-
61
-
62
-
63
-
64
-
65
-
66
-
67
-
68
-
69
-
70
-
71
-
72
-
73
-
74
-
75
-
76
-
77
-
78
-
79
-
80
-
81
-
82
-
83
-
84
-
85
-
86
-
87
-
88
-
89
-
90
-
91
-
92
-
93
-
94
-
95
-
96
-
97
-
98
-
99
-
100
-
101
-
102
-
103
-
104
-
105
-
 106
106 -
 107
107 -
 108
108 -
 109
109 -
 110
110 -
 111
111 -
 112
112 -
 113
113 -
 114
114 -
 115
115 -
 116
116 -
 117
117 -
 118
118 -
 119
119 -
 120
120 -
 121
121 -
 122
122 -
 123
123 -
 124
124 -
 125
125 -
 126
126 -
127
-
128
-
129
-
130
 |
 |

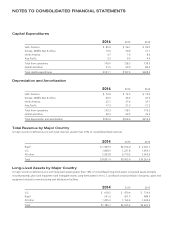
NOTES TO CONSOLIDATED FINANCIAL STATEMENTS
Capital Expenditures
2014 2013 2012
Latin America $ 82.6 $ 94.1 $ 99.0
Europe, Middle East & Africa 19.0 20.0 27.1
North America 4.7 7.6 8.6
Asia Pacific 3.3 6.6 4.6
Total from operations 109.6 128.3 139.3
Global and other 21.5 69.0 89.2
Total capital expenditures $131.1 $197.3 $228.5
Depreciation and Amortization
2014 2013 2012
Latin America $ 70.9 $ 72.2 $ 74.3
Europe, Middle East & Africa 40.0 46.6 47.0
North America 22.1 37.4 33.7
Asia Pacific 17.3 21.9 21.2
Total from operations 150.3 178.1 176.2
Global and other 42.3 46.5 36.3
Total depreciation and amortization $192.6 $224.6 $212.5
Total Revenue by Major Country
A major country is defined as one with total revenues greater than 10% of consolidated total revenues.
2014 2013 2012
Brazil $ 1,909.3 $2,014.0 $ 2,041.7
U.S. 1,008.3 1,221.8 1,454.1
All other 5,933.8 6,719.2 7,065.6
Total $ 8,851.4 $9,955.0 $10,561.4
Long-Lived Assets by Major Country
A major country is defined as one with long-lived assets greater than 10% of consolidated long-lived assets. Long-lived assets primarily
include property, plant and equipment and intangible assets. Long-lived assets in the U.S. and Brazil consist primarily of property, plant and
equipment related to manufacturing and distribution facilities.
2014 2013 2012
U.S. $ 418.5 $ 450.4 $ 714.4
Brazil 361.9 421.5 484.5
All other 1,005.3 1,153.4 1,232.6
Total $1,785.7 $2,025.3 $2,431.5