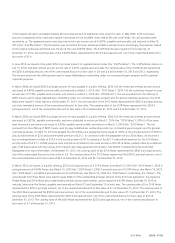
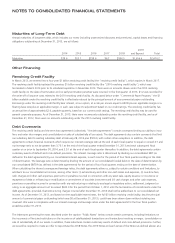
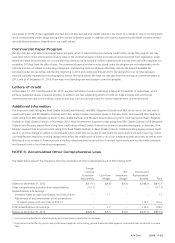
Avon 2013 Annual Report Download - page 99
Download and view the complete annual report
Please find page 99 of the 2013 Avon annual report below. You can navigate through the pages in the report by either clicking on the pages listed below, or by using the keyword search tool below to find specific information within the annual report.-
 1
1 -
2
-
3
-
4
-
5
-
6
-
7
-
8
-
9
-
10
-
11
-
12
-
13
-
14
-
15
-
16
-
17
-
18
-
19
-
20
-
21
-
22
-
23
-
24
-
25
-
26
-
27
-
28
-
29
-
30
-
31
-
32
-
33
-
34
-
35
-
36
-
37
-
38
-
39
-
40
-
41
-
42
-
43
-
44
-
45
-
46
-
47
-
48
-
49
-
50
-
51
-
52
-
53
-
54
-
55
-
56
-
57
-
58
-
59
-
60
-
61
-
62
-
63
-
64
-
65
-
66
-
67
-
68
-
69
-
70
-
71
-
72
-
73
-
74
-
75
-
76
-
77
-
78
-
79
-
80
-
81
-
82
-
83
-
84
-
85
-
86
-
87
-
88
-
 89
89 -
 90
90 -
 91
91 -
 92
92 -
 93
93 -
 94
94 -
 95
95 -
 96
96 -
 97
97 -
 98
98 -
 99
99 -
 100
100 -
 101
101 -
 102
102 -
 103
103 -
 104
104 -
 105
105 -
 106
106 -
 107
107 -
 108
108 -
 109
109 -
110
-
111
-
112
-
113
-
114
-
115
-
116
-
117
-
118
-
119
-
120
-
121
-
122
-
123
-
124
-
125
-
126
-
127
-
128
-
129
-
130
 |
 |
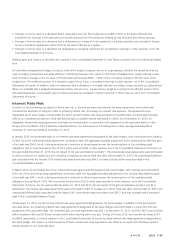
Credit Risk of Financial Instruments
We attempt to minimize our credit exposure to counterparties by entering into derivative transactions and similar agreements with major
international financial institutions with “A” or higher credit ratings as issued by Standard & Poor’s Corporation. Our foreign currency and
interest rate derivatives are comprised of over-the-counter forward contracts, swaps or options with major international financial institutions.
Although our theoretical credit risk is the replacement cost at the then estimated fair value of these instruments, we believe that the risk of
incurring credit risk losses is remote and that such losses, if any, would not be material.
Non-performance of the counterparties on the balance of all the foreign exchange agreements would have resulted in a write-off of $3.4 at
December 31, 2013. In addition, in the event of non-performance by such counterparties, we would be exposed to market risk on the
underlying items being hedged as a result of changes in foreign exchange rates.
NOTE 9. Fair Value
Assets and Liabilities Recorded at Fair Value
The fair value measurement provisions required by the Fair Value Measurements and Disclosures Topic of the Codification establish a fair
value hierarchy, which prioritizes the inputs used in measuring fair value into three broad levels as follows:
• Level 1 – Quoted prices in active markets for identical assets or liabilities.
• Level 2 – Inputs, other than the quoted prices in active markets, that are observable either directly or indirectly.
• Level 3 – Unobservable inputs based on our own assumptions.
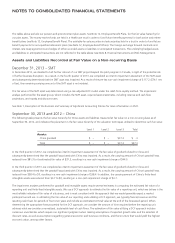
Assets and Liabilities Recorded at Fair Value on a Recurring Basis
The following table presents the fair value hierarchy for those assets and liabilities measured at fair value on a recurring basis as of
December 31, 2013:
Level 1 Level 2 Total
Assets:
Money market funds $ .5 $ – $ .5
Available-for-sale securities 2.5 – 2.5
Foreign exchange forward contracts – 3.4 3.4
Total $ 3.0 $ 3.4 $ 6.4
Liabilities:
Foreign exchange forward contracts $ – $ .3 $ .3
Total $ – $ .3 $ .3
The following table presents the fair value hierarchy for those assets and liabilities measured at fair value on a recurring basis as of
December 31, 2012:
Level 1 Level 2 Total
Assets:
Money market funds $26.9 $ – $ 26.9
Available-for-sale securities 1.9 – 1.9
Interest-rate swap agreements – 94.8 94.8
Foreign exchange forward contracts – 4.9 4.9
Total $28.8 $99.7 $128.5
Liabilities:
Interest-rate swap agreements $ – $ 1.7 $ 1.7
Foreign exchange forward contracts – 1.5 1.5
Total $ – $ 3.2 $ 3.2
A V O N 2013 F-29