Avon 2013 Annual Report Download - page 106
Download and view the complete annual report
Please find page 106 of the 2013 Avon annual report below. You can navigate through the pages in the report by either clicking on the pages listed below, or by using the keyword search tool below to find specific information within the annual report.-
 1
1 -
2
-
3
-
4
-
5
-
6
-
7
-
8
-
9
-
10
-
11
-
12
-
13
-
14
-
15
-
16
-
17
-
18
-
19
-
20
-
21
-
22
-
23
-
24
-
25
-
26
-
27
-
28
-
29
-
30
-
31
-
32
-
33
-
34
-
35
-
36
-
37
-
38
-
39
-
40
-
41
-
42
-
43
-
44
-
45
-
46
-
47
-
48
-
49
-
50
-
51
-
52
-
53
-
54
-
55
-
56
-
57
-
58
-
59
-
60
-
61
-
62
-
63
-
64
-
65
-
66
-
67
-
68
-
69
-
70
-
71
-
72
-
73
-
74
-
75
-
76
-
77
-
78
-
79
-
80
-
81
-
82
-
83
-
84
-
85
-
86
-
87
-
88
-
89
-
90
-
91
-
92
-
93
-
94
-
95
-
 96
96 -
 97
97 -
 98
98 -
 99
99 -
 100
100 -
 101
101 -
 102
102 -
 103
103 -
 104
104 -
 105
105 -
 106
106 -
 107
107 -
 108
108 -
 109
109 -
 110
110 -
 111
111 -
 112
112 -
 113
113 -
 114
114 -
 115
115 -
 116
116 -
117
-
118
-
119
-
120
-
121
-
122
-
123
-
124
-
125
-
126
-
127
-
128
-
129
-
130
 |
 |

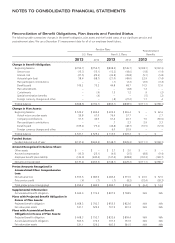
NOTES TO CONSOLIDATED FINANCIAL STATEMENTS
Reconciliation of Benefit Obligations, Plan Assets and Funded Status
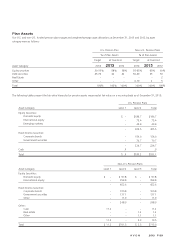
The following table summarizes changes in the benefit obligation, plan assets and the funded status of our significant pension and
postretirement plans. We use a December 31 measurement date for all of our employee benefit plans.
Pension Plans Postretirement
BenefitsU.S. Plans Non-U.S. Plans
2013 2012 2013 2012 2013 2012
Change in Benefit Obligation:
Beginning balance $(792.7) $(753.7) $(838.5) $(746.7) $(138.1) $(132.3)
Service cost (15.7) (15.1) (12.2) (18.0) (1.8) (1.9)
Interest cost (27.5) (29.6) (36.8) (39.8) (5.1) (5.8)
Actuarial gain (loss) 58.4 (68.7) (21.0) (49.6) 22.9 (7.4)
Plan participant contributions – – (.7) (2.3) (2.9) (3.3)
Benefits paid 109.2 75.2 44.8 48.7 10.5 12.6
Plan amendments – – – (4.8) 1.3 –
Curtailments – (.4) 1.5 1.2 .9 (.2)
Special termination benefits – (.4) – – (.5) (.2)
Foreign currency changes and other – – (.8) (27.2) 1.7 .4
Ending balance $(668.3) $(792.7) $(863.7) $(838.5) $(111.1) $(138.1)
Change in Plan Assets:
Beginning balance $ 529.2 $ 493.4 $ 609.3 $ 536.4 $ – $ 42.6
Actual return on plan assets 59.8 67.0 76.4 57.7 – 2.7
Company contributions 51.3 44.0 67.4 40.7 7.6 (36.0)
Plan participant contributions – – .7 2.3 2.9 3.3
Benefits paid (109.2) (75.2) (44.8) (48.7) (10.5) (12.6)
Foreign currency changes and other – – 6.0 20.9 – –
Ending balance $ 531.1 $ 529.2 $ 715.0 $ 609.3 $ – $ –
Funded Status:
Funded status at end of year $(137.2) $(263.5) $(148.7) $(229.3) $(111.1) $(138.1)
Amount Recognized in Balance Sheet:
Other assets $ – $ – $ 2.7 $ 2.0 $ – $ –
Accrued compensation (10.3) (23.1) (4.0) (2.5) (8.8) (9.4)
Employee benefit plans liability (126.9) (240.4) (147.4) (228.8) (102.3) (128.7)
Net amount recognized $(137.2) $(263.5) $(148.7) $(229.3) $(111.1) $(138.1)
Pretax Amounts Recognized in
Accumulated Other Comprehensive
Loss:
Net actuarial loss $ 355.6 $ 483.6 $ 283.4 $ 315.0 $ 26.0 $ 52.6
Prior service credit (.4) (.7) (.7) (8.2) (32.4) (38.3)
Total pretax amount recognized $ 355.2 $ 482.9 $ 282.7 $ 306.8 $ (6.4) $ 14.3
Supplemental Information:
Accumulated benefit obligation $ 663.6 $ 776.5 $ 807.9 $ 768.5 N/A N/A
Plans with Projected Benefit Obligation in
Excess of Plan Assets:
Projected benefit obligation $ 668.3 $ 792.7 $ 853.3 $ 822.6 N/A N/A
Fair value plan assets 531.1 529.2 701.9 591.3 N/A N/A
Plans with Accumulated Benefit
Obligation in Excess of Plan Assets:
Projected benefit obligation $ 668.3 $ 792.7 $ 832.6 $ 809.4 N/A N/A
Accumulated benefit obligation 663.6 776.5 797.5 761.9 N/A N/A
Fair value plan assets 531.1 529.2 687.5 581.5 N/A N/A