Avon 2013 Annual Report Download - page 43
Download and view the complete annual report
Please find page 43 of the 2013 Avon annual report below. You can navigate through the pages in the report by either clicking on the pages listed below, or by using the keyword search tool below to find specific information within the annual report.-
 1
1 -
2
-
3
-
4
-
5
-
6
-
7
-
8
-
9
-
10
-
11
-
12
-
13
-
14
-
15
-
16
-
17
-
18
-
19
-
20
-
21
-
22
-
23
-
24
-
25
-
26
-
27
-
28
-
29
-
30
-
31
-
32
-
 33
33 -
 34
34 -
 35
35 -
 36
36 -
 37
37 -
 38
38 -
 39
39 -
 40
40 -
 41
41 -
 42
42 -
 43
43 -
 44
44 -
 45
45 -
 46
46 -
 47
47 -
 48
48 -
 49
49 -
 50
50 -
 51
51 -
 52
52 -
 53
53 -
54
-
55
-
56
-
57
-
58
-
59
-
60
-
61
-
62
-
63
-
64
-
65
-
66
-
67
-
68
-
69
-
70
-
71
-
72
-
73
-
74
-
75
-
76
-
77
-
78
-
79
-
80
-
81
-
82
-
83
-
84
-
85
-
86
-
87
-
88
-
89
-
90
-
91
-
92
-
93
-
94
-
95
-
96
-
97
-
98
-
99
-
100
-
101
-
102
-
103
-
104
-
105
-
106
-
107
-
108
-
109
-
110
-
111
-
112
-
113
-
114
-
115
-
116
-
117
-
118
-
119
-
120
-
121
-
122
-
123
-
124
-
125
-
126
-
127
-
128
-
129
-
130
 |
 |
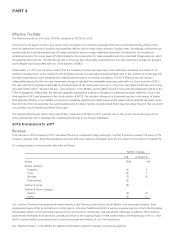
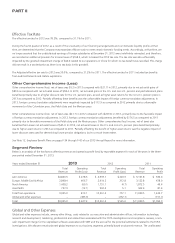
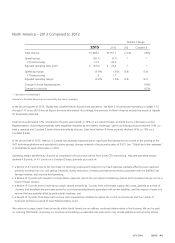
Operating Margin
Operating margin and Adjusted operating margin decreased 490 basis points and 360 basis points, respectively, compared to 2011. The
decreases in operating margin and Adjusted operating margin are discussed further below in “Gross Margin”, “Selling, General and
Administrative Expenses” and “Impairment of Goodwill and Intangible Asset.”
Gross Margin
Gross margin and Adjusted gross margin decreased by 220 basis points and 230 basis points, respectively, compared to 2011. The decrease
in Adjusted gross margin was primarily due to the following:
• a decline of 100 basis points due to higher supply chain costs, primarily caused by increased product costs which were partially due to
inflationary pressures;
• a decline of 80 basis points due to the unfavorable net impact of product mix and pricing, partly due to an increase in smart value
offerings as well as other initiatives to flow excess inventory; and
• a decline of 50 basis points due to the negative impact of foreign exchange.
Selling, General and Administrative Expenses
Selling, general and administrative expenses for 2012 decreased $53.2 compared to 2011. This decrease is primarily due to lower
distribution costs and lower advertising, partially offset by the negative impact of foreign exchange and higher CTI restructuring.
As a percentage of revenue, selling, general and administrative expenses increased 230 basis points, while Adjusted selling, general and
administrative expenses increased 130 basis points compared to 2011. The increase in Adjusted selling, general and administrative expenses
as a percentage of revenue was primarily due to the following:
• an increase of 60 basis points due to higher overhead expenses, primarily associated with wage inflation in 2012, as well as higher
expenses associated with employee incentive compensation plans;
• an increase of 60 basis points due to higher Representative and sales leader investment, primarily driven by investments in the One Simple
Sales Model in the U.S., partially offset by lower investments in China;
• an increase of 40 basis points due to the negative impact of foreign exchange; and
• a decrease of 30 basis points due to lower advertising costs.
Impairment of Goodwill and Intangible Asset
During the third quarter of 2012, we recorded a non-cash impairment charge of $44.0 in the third quarter of 2012 for goodwill associated
with our China business. See Note 17, Goodwill and Intangible Assets on pages F-52 through F-53 of our 2013 Annual Report for more
information.
See “Segment Review” in this MD&A for additional information related to changes in operating margin by segment.
Other Expense
Interest expense increased by 12% compared to the prior-year period, primarily due to higher outstanding debt balances and higher average
interest rates.
Interest income decreased by 8% compared to the prior-year period, primarily due to lower average interest rates partially offset by higher
average cash balances.
Other expense, net decreased by 80% compared to the prior-year period, primarily due to a benefit of $23.8 in 2012 due to the release of a
provision in the fourth quarter of 2012 associated with the excess cost of acquiring U.S. dollars in Venezuela at the regulated market rate as
compared with the official exchange rate. This provision was released as the Company capitalized the associated intercompany liabilities. See
“Segment Review – Latin America” in this MD&A for a further discussion of our Venezuela operations.
A V O N 2013 35