Avon 2013 Annual Report Download - page 100
Download and view the complete annual report
Please find page 100 of the 2013 Avon annual report below. You can navigate through the pages in the report by either clicking on the pages listed below, or by using the keyword search tool below to find specific information within the annual report.-
 1
1 -
2
-
3
-
4
-
5
-
6
-
7
-
8
-
9
-
10
-
11
-
12
-
13
-
14
-
15
-
16
-
17
-
18
-
19
-
20
-
21
-
22
-
23
-
24
-
25
-
26
-
27
-
28
-
29
-
30
-
31
-
32
-
33
-
34
-
35
-
36
-
37
-
38
-
39
-
40
-
41
-
42
-
43
-
44
-
45
-
46
-
47
-
48
-
49
-
50
-
51
-
52
-
53
-
54
-
55
-
56
-
57
-
58
-
59
-
60
-
61
-
62
-
63
-
64
-
65
-
66
-
67
-
68
-
69
-
70
-
71
-
72
-
73
-
74
-
75
-
76
-
77
-
78
-
79
-
80
-
81
-
82
-
83
-
84
-
85
-
86
-
87
-
88
-
89
-
 90
90 -
 91
91 -
 92
92 -
 93
93 -
 94
94 -
 95
95 -
 96
96 -
 97
97 -
 98
98 -
 99
99 -
 100
100 -
 101
101 -
 102
102 -
 103
103 -
 104
104 -
 105
105 -
 106
106 -
 107
107 -
 108
108 -
 109
109 -
 110
110 -
111
-
112
-
113
-
114
-
115
-
116
-
117
-
118
-
119
-
120
-
121
-
122
-
123
-
124
-
125
-
126
-
127
-
128
-
129
-
130
 |
 |

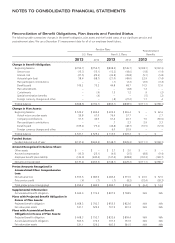
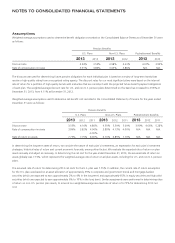
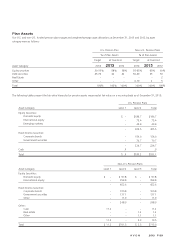
NOTES TO CONSOLIDATED FINANCIAL STATEMENTS
The tables above exclude our pension and postretirement plan assets. See Note 12, Employee Benefit Plans, for the fair value hierarchy for
our plan assets. The money market funds are held in a Healthcare trust in order to fund future benefit payments for both active and retiree
benefit plans (see Note 12, Employee Benefit Plans). The available-for-sale securities include securities held in a trust in order to fund future
benefit payments for non-qualified retirement plans (see Note 12, Employee Benefit Plans). The foreign exchange forward contracts and
interest-rate swap agreements are hedges of either recorded assets or liabilities or anticipated transactions. The underlying hedged assets
and liabilities or anticipated transactions are not reflected in the table above (see Note 8, Financial Instruments and Risk Management).
Assets and Liabilities Recorded at Fair Value on a Non-recurring Basis
December 31, 2013 – SMT
In December 2013, we decided to halt further roll-out of our SMT project beyond the pilot program in Canada, in light of the potential risk
of further business disruption. As a result, in the fourth quarter of 2013, we completed an interim impairment assessment of the SMT asset
and subsequently determined that the SMT asset was impaired. As a result of the pre-tax non-cash impairment charge of $117.2 ($74.1 net
of tax), the remaining carrying amount of the SMT asset is not material.
The fair value of the SMT asset was determined using a risk-adjusted DCF model under the relief-from-royalty method. The impairment
analysis performed for the asset group, which includes the SMT asset, required several estimates, including revenue and cash flow
projections, and royalty and discount rates.
See Note 1, Description of the Business and Summary of Significant Accounting Policies for more information on SMT.
September 30, 2013 and 2012 – China
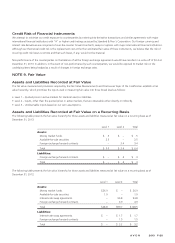
The following table presents the fair value hierarchy for those assets and liabilities measured at fair value on a non-recurring basis as of
September 30, 2012, and indicates the placement in the fair value hierarchy of the valuation techniques utilized to determine such fair value:
Level 1 Level 2 Level 3 Total
Assets:
China goodwill $ – $ – $37.3 $ .3
Total $ – $ – $37.3 $37.3
In the third quarter of 2012, we completed an interim impairment assessment of the fair value of goodwill related to China and
subsequently determined that the goodwill associated with China was impaired. As a result, the carrying amount of China’s goodwill was
reduced from $81.3 to its estimated fair value of $37.3, resulting in a non-cash impairment charge of $44.0.
In the third quarter of 2013, we completed an interim impairment assessment of the fair value of goodwill related to China and
subsequently determined that the goodwill associated with China was impaired. As a result, the carrying amount of China’s goodwill was
reduced from $38.4 to $0, resulting in a non-cash impairment charge of $38.4. In addition, the carrying amount of China’s finite-lived
intangible assets was reduced from $3.7 to $0, resulting in a non-cash impairment charge of $3.7.
The impairment analyses performed for goodwill and intangible assets require several estimates in computing the estimated fair value of a
reporting unit and finite-lived intangible assets. We use a DCF approach to estimate the fair value of a reporting unit, which we believe is the
most reliable indicator of fair value of a business, and is most consistent with the approach that we would generally expect a market
participant would use. In estimating the fair value of our reporting units utilizing a DCF approach, we typically forecast revenue and the
resulting cash flows for periods of five to ten years and include an estimated terminal value at the end of the forecasted period. When
determining the appropriate forecast period for the DCF approach, we consider the amount of time required before the reporting unit
achieves what we consider a normalized, sustainable level of cash flows. The estimation of fair value utilizing a DCF approach includes
numerous uncertainties which require our significant judgment when making assumptions of expected growth rates and the selection of
discount rates, as well as assumptions regarding general economic and business conditions, and the structure that would yield the highest
economic value, among other factors.