Avon 2013 Annual Report Download - page 116
Download and view the complete annual report
Please find page 116 of the 2013 Avon annual report below. You can navigate through the pages in the report by either clicking on the pages listed below, or by using the keyword search tool below to find specific information within the annual report.-
 1
1 -
2
-
3
-
4
-
5
-
6
-
7
-
8
-
9
-
10
-
11
-
12
-
13
-
14
-
15
-
16
-
17
-
18
-
19
-
20
-
21
-
22
-
23
-
24
-
25
-
26
-
27
-
28
-
29
-
30
-
31
-
32
-
33
-
34
-
35
-
36
-
37
-
38
-
39
-
40
-
41
-
42
-
43
-
44
-
45
-
46
-
47
-
48
-
49
-
50
-
51
-
52
-
53
-
54
-
55
-
56
-
57
-
58
-
59
-
60
-
61
-
62
-
63
-
64
-
65
-
66
-
67
-
68
-
69
-
70
-
71
-
72
-
73
-
74
-
75
-
76
-
77
-
78
-
79
-
80
-
81
-
82
-
83
-
84
-
85
-
86
-
87
-
88
-
89
-
90
-
91
-
92
-
93
-
94
-
95
-
96
-
97
-
98
-
99
-
100
-
101
-
102
-
103
-
104
-
105
-
 106
106 -
 107
107 -
 108
108 -
 109
109 -
 110
110 -
 111
111 -
 112
112 -
 113
113 -
 114
114 -
 115
115 -
 116
116 -
 117
117 -
 118
118 -
 119
119 -
 120
120 -
 121
121 -
 122
122 -
 123
123 -
 124
124 -
 125
125 -
 126
126 -
127
-
128
-
129
-
130
 |
 |

NOTES TO CONSOLIDATED FINANCIAL STATEMENTS
approximately $165 to $170 (both before taxes). For market closures, the annualized savings represent the foregone selling, general and
administrative expenses as a result of no longer operating in the respective markets. For actions that did not result in the closure of a market,
the annualized savings represent the net reduction of expenses that will no longer be incurred by Avon. The annualized savings do not
incorporate the impact of the decline in revenue associated with these actions (including market closures), which is not expected to be
material.
Restructuring Charges – 2013
During 2013, we recorded total costs to implement of $68.4 related to the $400M Cost Savings Initiative, and the costs consisted of the
following:
• net charge of $50.4 primarily for employee-related costs, including severance and pension and postretirement benefits;
• accelerated depreciation of $13.9 associated with the closure and rationalization of certain facilities;
• contract termination and other charges of $4.8, primarily related to the costs associated with our exit from the Republic of Ireland market;
• net benefit of $3.5 due to accumulated foreign currency translation adjustments in the second quarter of 2013 primarily associated with
our exit from the Vietnam market;
• implementation costs of $3.3 for professional service fees;
• net benefit of $.7 due to inventory adjustments in the first and second quarters of 2013; and
• net loss of $.2 due to the sale of a facility in the U.S.
Of the total costs to implement, $69.1 was recorded in selling, general and administrative expenses and a net benefit of $.7 was recorded in
cost of sales, in the Consolidated Statements of Income. The majority of cash payments, if applicable, associated with these charges were
made in 2013 and the remaining are expected to be made during 2014.
Restructuring Charges – 2012
During 2012, we recorded total costs to implement of $50.7 related to the $400M Cost Savings Initiative, and the costs consisted of the
following:
• net charge of $45.2 primarily for employee-related costs, including severance and pension and postretirement benefits;
• accelerated depreciation of $2.2 associated with the closure and rationalization of certain facilities;
• contract termination and other charges of $1.9 primarily related to the closure of certain facilities and our exit from the South Korea
market; and
• inventory write-offs of $1.4 associated with the exit of our South Korea and Vietnam markets.
Of the total costs to implement, $49.3 was recorded in selling, general and administrative expenses and $1.4 was recorded in cost of sales,
in the Consolidated Statements of Income.
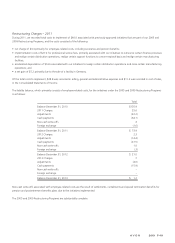
The liability balance for the $400M Cost Savings Initiative as of December 31, 2013 is as follows:
Employee-
Related
Costs
Inventory/
Asset
Write-offs
Currency
Translation
Adjustment
Write-offs
Contract
Terminations/
Other Total
2012 Charges $ 45.2 $ 1.4 $ – $ 1.9 $ 48.5
Cash payments (3.2) – – (.2) (3.4)
Non-cash write-offs (.8) (1.4) – – (2.2)
Foreign exchange .1 – – – .1
Balance at December 31, 2012 $ 41.3 $ – $ – $ 1.7 $ 43.0
2013 Charges 54.4 .1 (3.5) 5.3 56.3
Adjustments (4.0) (.8) – (.5) (5.3)
Cash payments (44.9) – – (4.8) (49.7)
Non-cash write-offs (.2) .7 3.5 – 4.0
Foreign exchange .1 – – .1 .2
Balance at December 31, 2013 $ 46.7 $ – $ – $ 1.8 $ 48.5